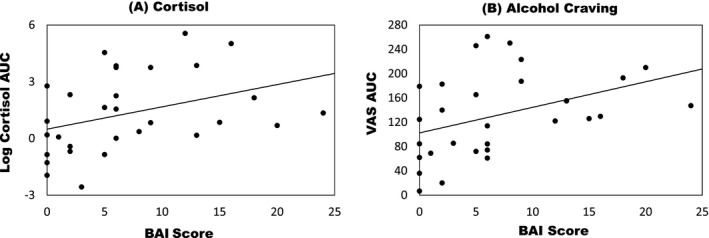
Figure 2.

Scatter plots of the associations of Beck Anxiety Inventory (BAI) scores against stress‐induced cortisol (Panel A) and alcohol craving (Panel B) measured during the alcohol‐motivated response period following the Trier Social Stress Test. Data points represent individual participants. Due to the high skewness, cortisol values were first log‐transformed. The area under the curve (AUC) subtracting baseline of the transformed cortisol values is shown. Similarly, the AUC of visual analog scale (VAS) craving scores was calculated with baseline subtracted and is shown in the plot. No transformation was performed on VAS AUC.
