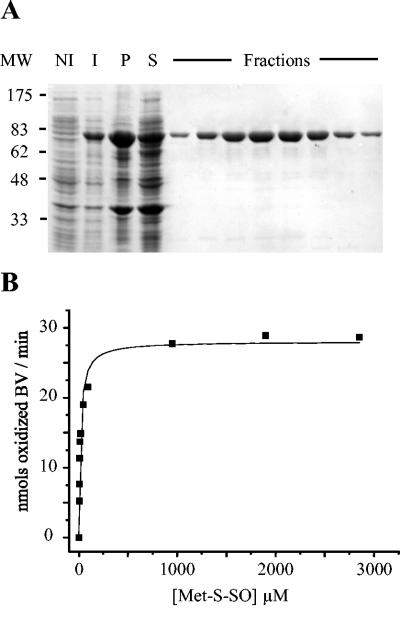
FIG. 4.
Biochemical characterization of E. coli BisC. (A) SDS-PAGE analysis of samples taken through the different steps of the purification protocol. MW, molecular size markers; NI, cell extracts prior to IPTG induction; I, cell extracts after 2 h of IPTG induction; P, insoluble material from French press-treated cells; S, soluble material from French press-treated cells. the lanes labeled Fractions contained different samples eluted from the Hi-trap column (see Materials and Methods). The BisC protein-containing band runs with an apparent molecular mass of 85 kDa. (B) Kinetic analysis of BisC activity, using Met-S-SO as a substrate. Enzymatic activity tests were run under anaerobiosis in the presence of excess dithionite, reduced benzyl viologen (BV), BisC (9 nM), and increasing concentrations of Met-S-SO, 4.75 μM, 6.3 μM, 9.5 μM, 11.9 μM, 19 μM, 47.5 μM, 95 μM, 950 μM, 1.9 mM, and 2.8 mM.

