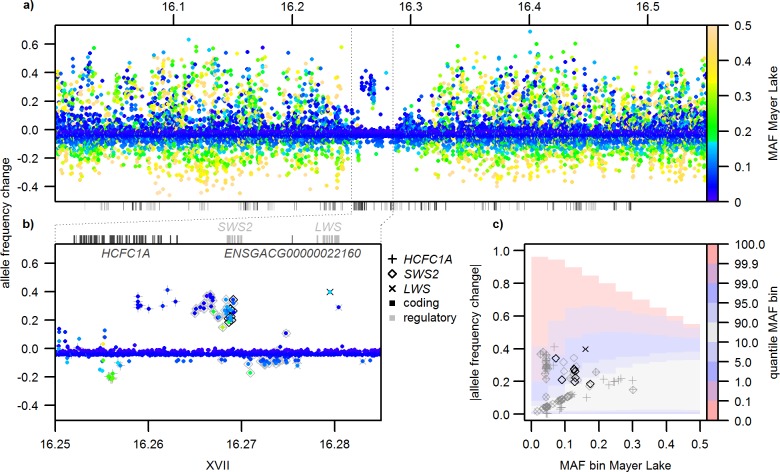
Fig 4. Allele-frequency change around SWS2 and LWS in the selection experiment.
Distribution of single SNP allele-frequency change in the selection experiment (Roadside Pond minus Mayer Lake) around the selective sweep region on chromosome XVII (a,b). Note the unexpectedly strong increase of low frequency alleles linked to blue-shifting SWS2 coding variation after the transplant to a clear water pond. Color codes in (a) and (b) show “starting” allele frequencies, i.e., minor allele frequencies (MAFs) in Mayer Lake, color codes in (c) indicates the genome-wide distribution of allele-frequency change for Mayer Lake MAF bins of 0.05 width. Symbol shapes and colors in (b) and (c) indicate associations with different genes and predicted effects. Black and grey boxes below (a) and above (b) are exons of genes surrounding the sweep region. Depicted allele frequencies and allele-frequency change quantiles can be found in S1 Data.

