
Figure 8.
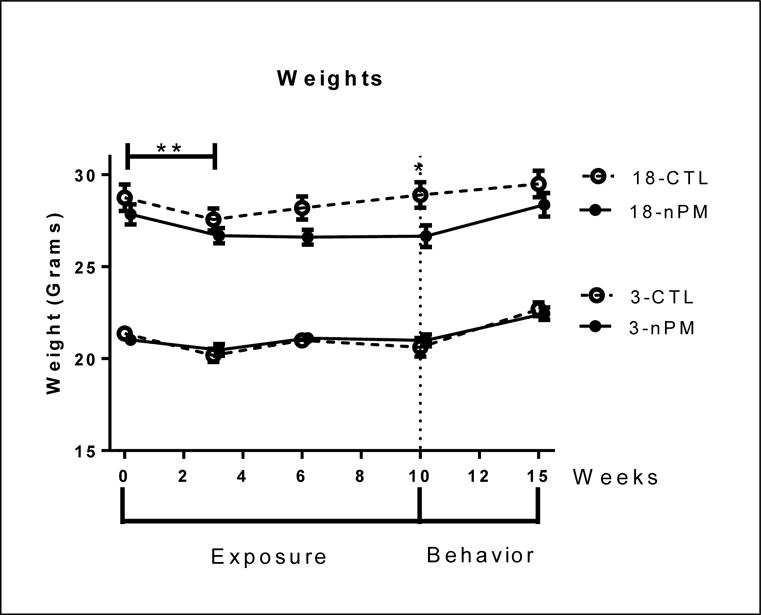
Body weight throughout exposure and 1 m post exposure. All groups showed initial weight loss (p<0.01, two-way ANOVA). All young mice and older controls recovered weight during the exposure, unlike older exposed mice; difference post exposure (p<0.05, one-way ANOVA). Older exposed mice recovered weight 1 m post exposure. Mean +/− SEM; N=9 per group.