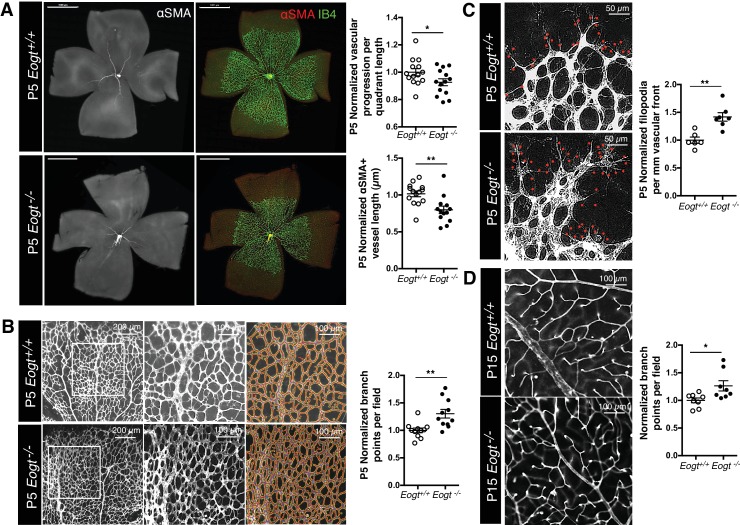
Figure 5. EOGT regulates retinal angiogenesis.
(A) Whole-mount images of Eogt+/+ or Eogt−/− P5 retinas stained with IB4 and anti-αSMA antibody. Bars represent 1000 μm. Scatter plots at right show vascular progression per quadrant length, per retina, and αSMA+ vessel length from the optic nerve per retina, normalized to Eogt+/+ retinas (taken as 1.0). Each symbol represents average vessel progression from 3 to 4 quadrants, or the average length from the optic nerve of 3–4 αSMA+ vessels, per retina. For Eogt+/+, average vascular progression was 0.63 ± 0.03, and the average αSMA+ vessel length was 962 ± 58 µm. (B) Images of P5 vascular front of Eogt+/+ or Eogt−/− retinas stained with IB4. Scatter plot at right shows the normalized number of vascular branch points (500 × 500 µm field (n = 3–8 fields per retina), N = 11 mice). Each symbol represents the average per retina, per mouse. The average Eogt+/+ branch points were 302 ± 27 per retina, taken as 1.0 for normalization. (C) Images of filopodia emanating from tip cells (red dots) at the vascular front. The scatter plot at right shows the number of filopodia in P5 retinas (250 × 250 µm field (n = 4–12 fields per retina), N = 6 mice). The average filopodia per mm vascular front for Eogt+/+ was 33 ± 2 per mm, taken as 1.0 for normalization. (D) Images of P15 retinas stained with IB4. The scatter plot at right shows number of branch points in P15 retinas (500 × 500 µm field (n = 3–8 fields per retina), N = 8 mice). The average for Eogt+/+ was 74 ± 3 per field. Data were normalized from mean ± standard error; p values were calculated by unpaired two-tailed Student’s TTEST. *p≤0.05; **p≤0.01; ***p≤0.001.


