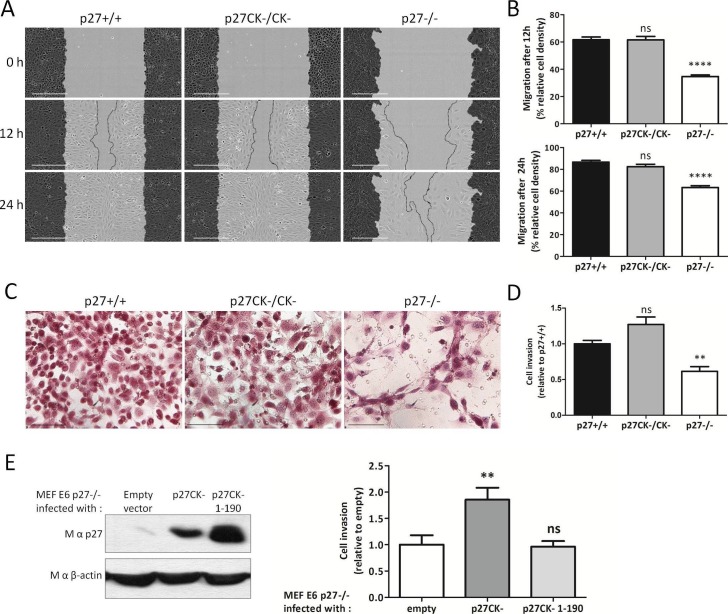
Figure 4. p27 promotes cell migration and invasion.
(A) Representative images of scratch wound migration assays with p27+/+, p27CK−/CK− and p27−/− immortalized MEFs. Dark grey areas show the initial wound masks and dotted lines the migration fronts. Scale bars: 300 μm. (B) Mean cell migration at 12 hr and 24 hr post wounding for each genotype of five independent experiments. Percent of area in which the cells migrated, or wound closing (relative wound density) was calculated with the Incucyte software. ‘ns’: not significant; ****p<0.0001. (C) Representative images of p27+/+, p27CK−/CK− and p27−/− immortalized MEFs that invaded through a layer of Collagen I in transwell invasion assays and migrated to the bottom side of the transwell membrane after 48 hr. Scale bars: 100 μm. (D) The graph shows the mean number of cells that invaded through Collagen I quantified by XTT staining, expressed relative to p27+/+ cells, of three independent experiments. **p<0.01. (E) p27−/− E6 MEFs were infected with either empty vector, p27CK- or p27CK- 1–190 vectors and used in transwell invasion assays as in (C–D). p27 levels after retroviral infection were determined by immunoblot with mouse anti-p27 (SX53G8.5); β-actin was used as loading control. The graph shows the mean number of cells that invaded through Collagen I quantified by XTT staining, expressed relative to p27−/− cells, of four independent experiments.
DOI: http://dx.doi.org/10.7554/eLife.22207.015

