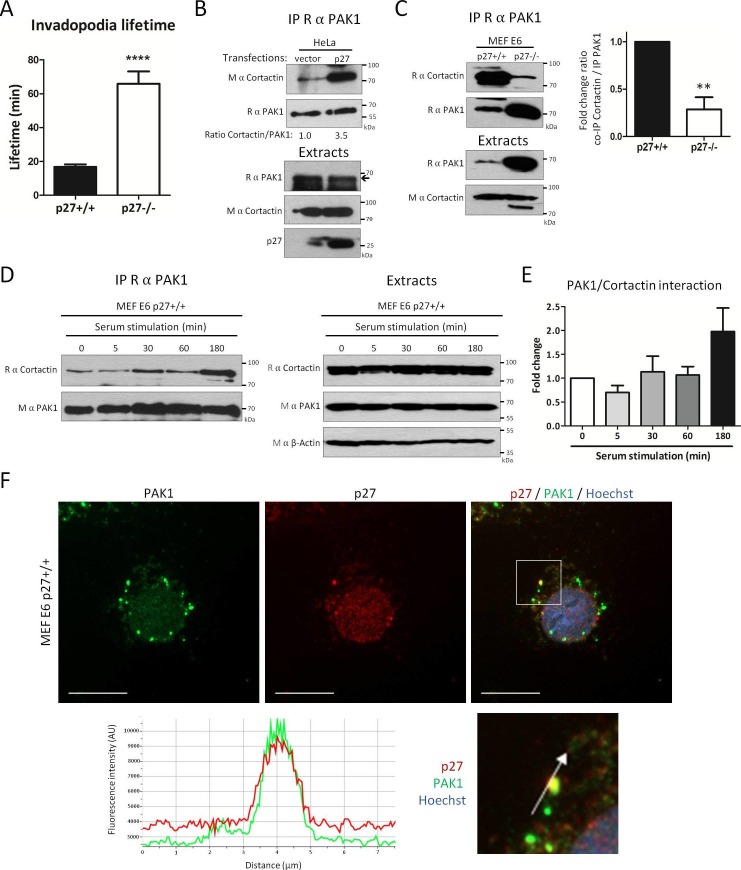
Figure 5. p27 promotes binding of Cortactin to PAK1.
(A) Live p27+/+ and p27−/− immortalized MEFs expressing eGFP-Tks5 were imaged by videomicroscopy to measure invadopodia lifetime, using Tks5 as an invadopodia marker. The graph represents the average invadopodia lifetime of 20 invadopodia per genotype per experiment from three independent experiments. (B–C) Co-immunoprecipitations using rabbit anti-PAK1 (N-20) of HeLa cell lysates transfected with empty vector or p27 encoding vector (B) or p27+/+ and p27−/− E6 MEF lysates (C). Co-immunoprecipitated Cortactin was detected with mouse (B) or rabbit (C) anti-Cortactin antibodies. Immunoprecipitated PAK1 was visualized by reprobing the membranes with rabbit anti-PAK1 (N-20) and anti-Rabbit Ig light-chain secondary antibodies. Immunoblots of extracts show the level of proteins in each condition. In (C), the graph shows the mean fold change in the ratio of Cortactin to PAK1 co-immunoprecipitated, expressed relative to p27+/+ cells, in three independent experiments. **p<0.01. (D) p27+/+E6 MEFs were starved overnight in DMEM 0.1% FCS and then stimulated with growth medium for the indicated times. PAK1 was immunoprecipitated from cell lysates using rabbit anti-PAK1 (N-20). Immunoblots of immunoprecipitates (left panels) and extracts (right panels) were probed successively with rabbit anti-Cortactin (H-191) and anti-rabbit Ig light chain secondary antibodies and then with mouse anti-PAK1 (A6) antibodies. β-actin was used as loading control. (E) The graph shows the mean amount of Cortactin bound to PAK1 at each time-point from four independent experiments, normalized to time zero. These differences were not statistically significant. (F) p27+/+ MEFs were seeded on coverslips and permeabilized with digitonin prior to fixation. Cells were labeled with rabbit anti-PAK1 (N-20, green) and mouse anti p27 (SX53G8.5, red) antibodies. Images were acquired using a 60x objective and images displayed are cropped areas. The graph displaying the fluorescence intensity (arbitrary unit) under the arrow in the enlarged panel was generated with NIS Element software. Scale bars: 20 μm.
DOI: http://dx.doi.org/10.7554/eLife.22207.018


