. 2017 Mar 13;6:e22207. doi: 10.7554/eLife.22207

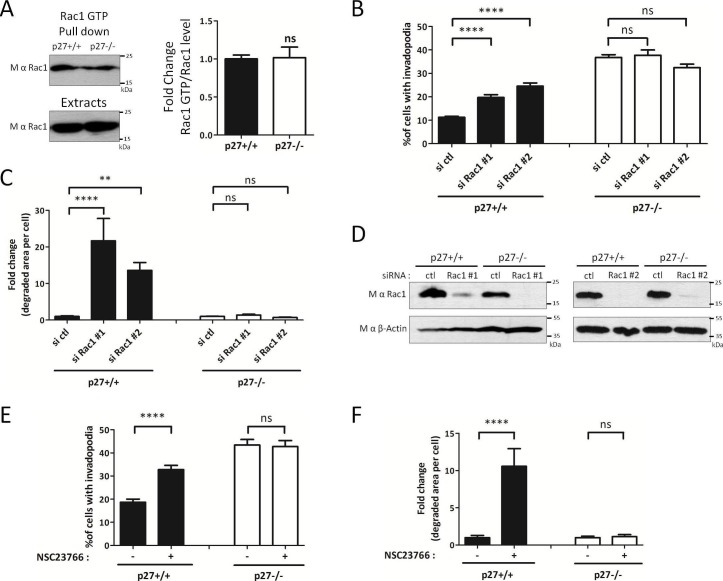
Figure 7. p27 regulates invadopodia formation downstream of Rac1.

(A) Cells were seeded for 24 hr and Rac1-GTP levels measured by GTP pull-downs assays using GST-PAK1-CD beads. The amounts of Rac1-GTP bound to the beads and of total Rac1 in the extracts were detected by immunoblot with mouse anti-Rac1. The graph shows the mean ratio of GTP-Rac1/total Rac1 from six independent experiments. (B–D) Cells were transfected with control (ctl) or Rac1 #1 or #2 siRNAs for 3 days. Cells were then seeded on Gelatin-A488 for 48 hr and for monitoring siRNA efficiency. Cells were stained with rabbit anti-Tks5 (M-300) to visualize invadopodia. At least ten fields per condition were used to count cells forming invadopodia, representing a minimum of 197 cells per genotype for each experiment (B) or to measure the area of degraded gelatin, expressed in fold-change compared to control siRNA treated conditions (C). (D) Rac1 silencing was evaluated by immunoblot with mouse anti-Rac1. β-actin was used as loading control. (E–F) Cells were processed as described in Figure 6D and E except that the Rac1 inhibitor NSC23766 at 100 μM was used instead of FRAX597. A minimum of 153 cells were counted per genotype for each experiment. (B–C; E–F) The graphs show the mean of at least three independent experiments. ****p<0.0001; **p<0.01.

DOI: http://dx.doi.org/10.7554/eLife.22207.028

Figure 7—source data 1. Quantification of Rac1 GTP/Rac1 levels (Figure 7A); quantification of invadopodia forming cells (Figure 7B) and degraded gelatin area (Figure 7C) after silencing of Rac1; quantification of invadopodia forming cells (Figure 7E) and degraded gelatin area (Figure 7F) after NSC23766 treatment; quantification of invadopodia forming cells (Figure 7—figure supplement 1A) and degraded gelatin area (Figure 7—figure supplement 1B) after RhoA silencing; and quantification of invasion after Y27632 treatment (Figure 7—figure supplement 1D).
elife-22207-fig7-data1.xlsx (118.9KB, xlsx)
DOI: 10.7554/eLife.22207.029
Figure 7—source data 2. Statistical analyses for Figure 7A,B,C,E,F, and Figure 7—figure supplement 1A,B and D.
DOI: 10.7554/eLife.22207.030

Figure 7.

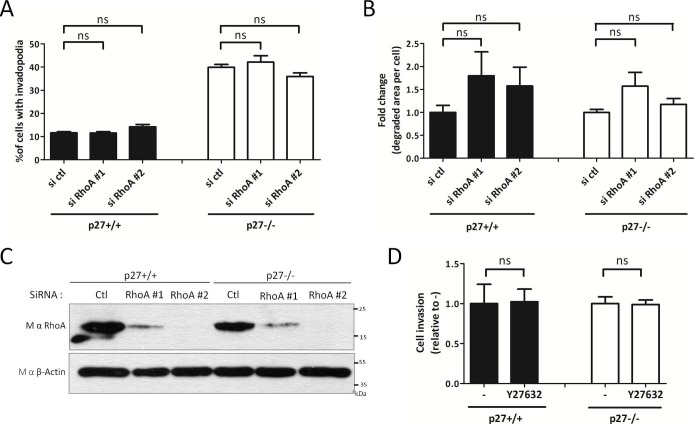
Figure 7—figure supplement 1. RhoA regulation by p27 is not involved in invadopodia formation.

Figure 7—figure supplement 1.

(A–C) p27+/+ and p27−/− immortalized MEFs were transfected with siRNA control (ctl) or siRNA RhoA #1 or #2. After 3 days, cells were seeded on Gelatin-A488 for matrix degradation and for controlling siRNA efficiencies, for 48 hr. Cells were stained with rabbit anti-Tks5 (M-300) to visualize invadopodia. For each experiment, ten fields per condition, representing a minimum of 256 cells per genotype, were used to count invadopodia forming cells (A) or the area of degraded gelatin per cell (B). The graphs show the means of at least three independent experiments. (C) siRNA efficiency was evaluated by immunoblot with mouse anti-RhoA (26C4) antibodies. β-actin was used as loading control. (D) p27+/+ and p27−/− immortalized MEFs were subjected to invasion assays as in Figure 4C–D in presence or absence of the ROCK inhibitor Y27632 (10 μM). The graph shows the fold change in invasion relative to vehicle treated cells (-) from three independent experiments.