. 2017 Mar 13;6:e22207. doi: 10.7554/eLife.22207

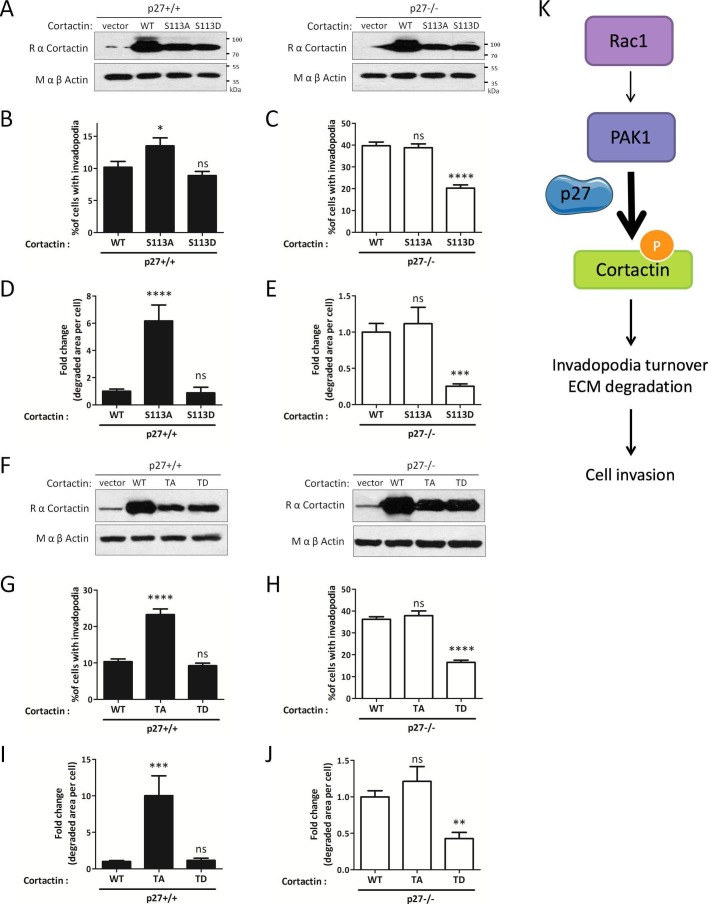
Figure 8. Mimicking phosphorylation of Cortactin restores invadopodia dynamics in p27−/− cells.

(A–E) p27−/− E6 MEFs were infected with empty vector or with vectors encoding wild type Cortactin (WT), S113A-Cortactin (S113A) or S113D-Cortactin (S113D). (A) Cortactin levels after retroviral infection were determined by immunoblot with rabbit anti-Cortactin (H-191) antibodies. β-actin was used as loading control. (B–E) Cells were seeded on gelatin-A488 for 48 hr. After Tks5 staining, cells forming invadopodia (B–C), or the area of degraded gelatin, expressed in fold-change compared to WT Cortactin transfected cells (D–E), were quantified in at least ten fields per condition in each experiment, representing a minimum of 179 cells per genotype. The graphs show the means of at least three independent experiments. (F–J) p27−/− E6 MEFs were infected with empty vector or with vectors encoding WT Cortactin, Cortactin TA (S113A/S150A/S282A) or Cortactin TD (S113D/S150D/S282D). (J) Cortactin levels after retroviral infection were determined as in (A). (G–J) Cells were processed as in (B–E) to quantify cells forming invadopodia (G–H), or the area of degraded gelatin (I–J), with a minimum of 222 cells counted per genotype per experiment. The graphs show the means of 3 independent experiments. (K) Schematic representation of the Rac1/PAK1/phospho-Cortactin pathway involved in invadopodia turnover and matrix degradation and its proposed regulation by p27. ****p<0.0001; ***p<0.001; **p<0.01; *p<0.05.

DOI: http://dx.doi.org/10.7554/eLife.22207.032

Figure 8—source data 1. Quantification of cells forming invadopodia (Figure 8B–C) and degraded gelatin area (Figure 8D–E) after infection with S113 phospho-mutants of Cortactin; quantification of cells forming invadopodia (Figure 8G–H) and degraded gelatin area (Figure 8I–J) after infection with triple phospho-mutants of Cortactin; quantification of P-Ser Cortactin/Cortactin ratio (Figure 8—figure supplement 1B).
DOI: 10.7554/eLife.22207.033
Figure 8—source data 2. Statistical analyses for Figure 8.
DOI: 10.7554/eLife.22207.034
Figure 8—source data 3. Statistical analyses for Figure 8—figure supplement 1B.
DOI: 10.7554/eLife.22207.035
Figure 8—source data 4. Mascot search results for Cortactin for Figure 8—figure supplement 2.
DOI: 10.7554/eLife.22207.036

Figure 8.

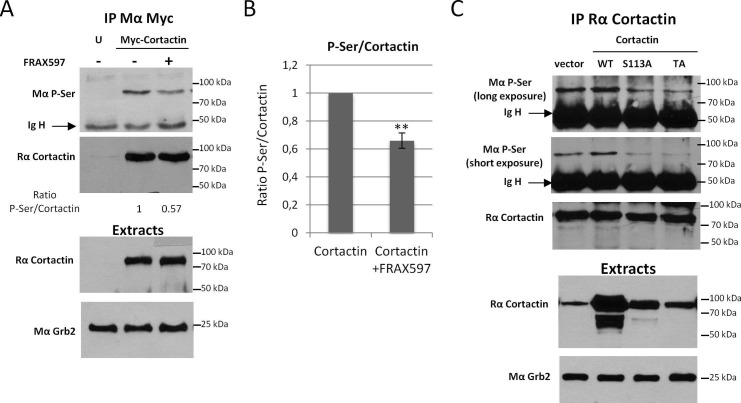
Figure 8—figure supplement 1. Cortactin is phosphorylated on S113/S150 and/or S282 in vivo.

Figure 8—figure supplement 1.

(A) HEK 293 cells were tranfected with Myc-tagged Cortactin for 24 hr or left untransfected (U) and 3 μM FRAX597 was added for 12 hr where indicated. Cortactin was immunoprecipitated with anti-Myc antibodies (9E10) and resolved on SDS-PAGE and transferred on PVDF membranes. The amount of Ser-phosphorylated Cortactin was detected by immunoblot with a monoclonal antibody against phospho-serine (BD) and the total amount of immunoprecipitated Cortactin by reprobing with anti-Cortactin (H191) antibody. P-Ser and Cortactin band intensities were quantified with Image J to calculate ratios, normalized to one for the control condition. Extracts were probed for Cortactin and Grb2 was used as loading control. (B) Average ratio of P-Ser signal/Total Cortactin signals from three independent experiments. Error bars are s.e.m. **p<0.01. (C) HEK 293 cells were tranfected with either empty vector, wild-type Cortactin (WT), S113A Cortactin or S113A/S150A/S282A (TA) Cortactin for 24 hr. Cortactin was immunoprecipitated with anti-Cortactin (H191) antibodies and processed as in (A). Serine phosphorylation of Cortactin was evaluated with anti-Phospho-Ser antibodies (BD). This data is representative of three independent experiments.
Figure 8—figure supplement 2. Cortactin is phosphorylated on S150 in vivo upon PAK activation.

Figure 8—figure supplement 2.

MS/MS analysis of Cortactin immunoprecipitated from HEK 293 cells transfected either with Myc-Cortactin or Myc-Cortactin and Myr-SH3-2, the second SH3 domain of Nck1 fused to the myristoylation signal of Src, which activate PAK kinase. S150 phosphorylation was only detected from lysates in which PAK activtiy was stimulated by the presence of the Src-SH3-2 domain. (A) MS/MS spectrum annotation of the residues 148–161 from Uniprot database reference SRC8_HUMAN or Q14247 (Src substrate Cortactin) protein. MS-Fragmented peptide correspond to the m/z selection of 516.888, matching [HASQKDYSSGFGGK +80 Da (HPO3)]3+ among 691 spectrum matching 98 distinct sequences of the same protein. Measured fragment matching masses bearing the modified serine residue showing a loss of neutral mass (H3PO4) are indicated in yellow. Not all the annotations could fit in the figure. The table below gathers all the matching fragments. (B) Table of theoretical fragment masses for the residues 148–161 of Uniprot database reference SRC8_HUMAN or Q14247 (Src substrate Cortactin) protein. In red are experimental masses of m/z detection of 516.888 matching [HApSQKDYSSGFGGK]3+ from the above spectrum. (C) Table of possible matches of the same set of experimental data with the four possible and closest theoretical sequences. The best score matches the phosphorylation of the serine 150 among the residues 148–161 of Uniprot database reference SRC8_HUMAN or Q14247 (Src substrate Cortactin) protein. Site analysis percentage corresponds to the probability output from the PhosphoRS algorythm.