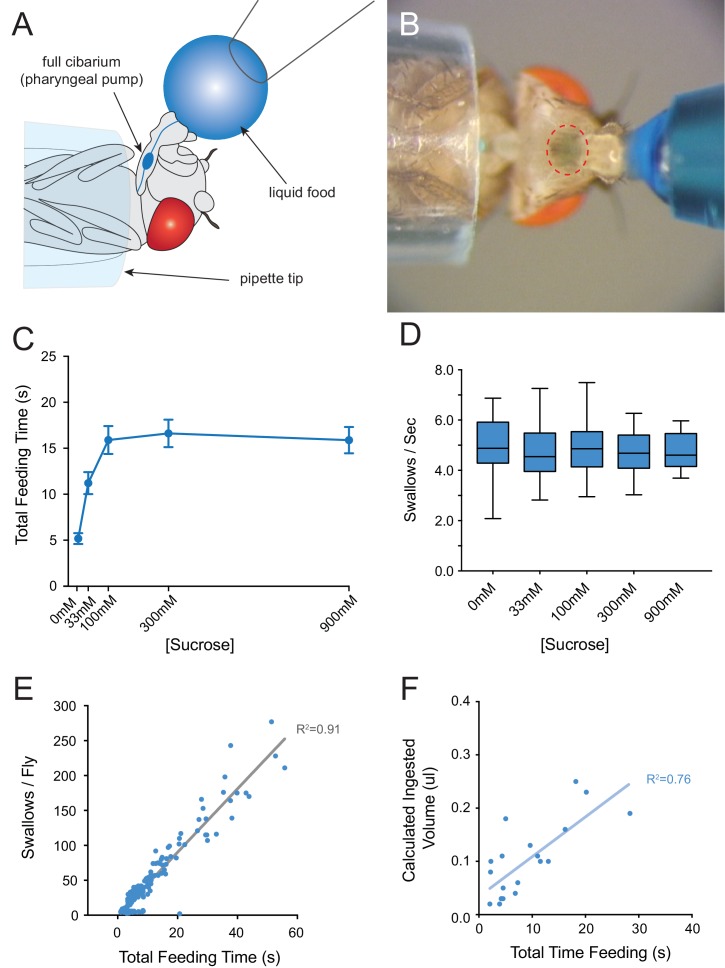
Figure 3. Consumption of sucrose in a modified pharyngeal pumping assay.
(A) Diagram of assay. Figure adapted from Figure 2B of Delventhal et al. (2017). (Delventhal et al., 2017) (B) Blue dye allows visualization of filling and emptying of the cibarium (red-dashed circle). (C) Total feeding time of w Canton-S females as a function of sucrose concentration. n = 37–108. (D) Swallowing rate of flies as a function of sucrose concentration. Medians do not differ (one-way ANOVA, Bonferroni post-test, n = 22–34). Lines indicate medians; boxes indicate 25% quartiles above and below the median; whiskers indicate range of values. (E) Correlation analysis of total number of swallows per fly vs. total feeding time. Data are from all concentrations tested in (C). R2 = 0.91, ***p<0.001, Pearson’s correlation test, n = 140. (F) Correlation analysis of calculated volumes of 900 mM sucrose ingested vs. total feeding time (***p<0.001, R2 = 0.76, Pearson’s correlation test, n = 20). Flies consumed ~8 nanoliters/s, which is comparable to reported values (Qi et al., 2015; Yapici et al., 2016). Volumes were determined by extracting dye from single flies after feeding, and measuring the absorbance of each sample. Absorbance values were converted into calculated volumes using the slope of a standard absorbance curve for the concentration of the blue dye (see Materials and methods). 12 hr starved, mated females were used in this and all other assays.


