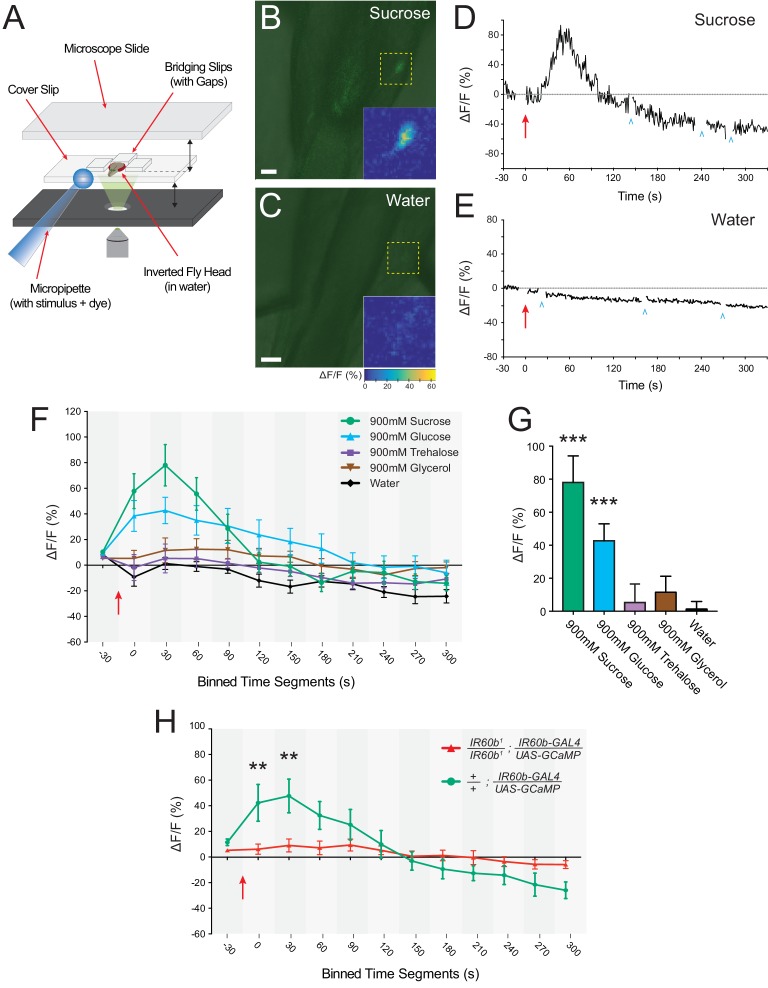
Figure 7. The IR60b neuron responds to sucrose and the response depends on IR60b .
(A) The preparation used for imaging of cell bodies of the IR60b neurons. (B–C) Confocal images of merged green fluorescence and DIC channels showing IR60b-GAL4/+; IR60b-GAL4/UAS-GCaMP6s preparations during the delivery of (B) 900 mM sucrose or (C) water. Inset heat maps show the change in fluorescence at 60 s, after the addition of the stimulus. Yellow dashed boxes outline the regions shown in heat maps. Scale bars = 10 um. (D–E) Representative traces showing changes in fluorescence for (D) the 900mM sucrose stimulus or (E) water. Blue arrowheads indicate frames excluded because the sample was being re-focused to the appropriate plane of focus. Red arrows indicate time of stimulus application. (F) Time course of change in fluorescence (∆F/F) for flies that received the indicated stimuli. Values on x-axis represent binned, 30 s intervals, for example, “0” indicates the 0-29 s bin; “30” indicates the 30-59 s bin. The 900mM sucrose response differed from the water response between 0 and 120 s (p***<0.001 for 0-29 s, 30-59 s, and 60-89 s bins; *p<0.05 for the 90-119 s bin, two-way ANOVA, Bonferroni post-test, n=7-12). The response to the 900 mM glucose stimulus differed from the water response between 0 and 180 s (p***<0.001 for 0-29 s and 30-59 s bins, and **p<0.01 for 60-89 s, 90-119 s, 120-149 s, and 150-179 s bins, n=7-12). (G) Bar graph of ∆F/F values from the 30-59 s bin in (F), illustrating differences during the bin of maximal fluorescence. (H) Time course of fluorescence in IR60b1/IR60b1; IR60b-GAL4/UAS-GCaMP6s flies and control flies in response to 900mM sucrose. Values on x-axis are binned in 30 s intervals as in (F). ∆F/F values differed between 0 and 60 s (**p<0.01 for 0-29 s and 30-59 s bins, two-way ANOVA, Bonferroni post-test, n=7-12).


