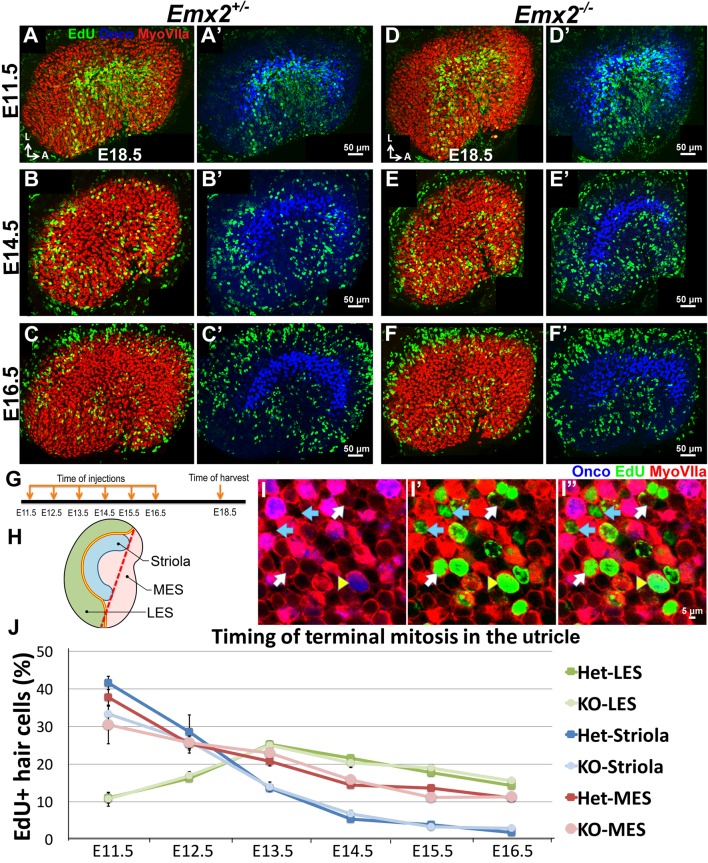
Figure 3. Regional differences in timing of cell cycle exit are maintained in the Emx2-/- utricle.
(A–C’) E18.5 Emx2+/- utricles injected with EdU at E11.5 (A-A’; n = 3), E14.5 (B-B’; n = 3), or E16.5 (C-C’; n = 3) and harvested at E18.5 (G) were processed for anti-Myosin VIIa (HC marker), anti-oncomodulin (striolar marker), and incorporated EdU. Abundant labeling is observed in the striola when the utricle is exposed to EdU at E11.5 (A) and not at E14.5 (B) and E16.5 (C), whereas labeling in the MES is observed in all three ages but weakest at E16.5 (C). In contrast, EdU labeling is not apparent in the LES at E11.5 (A) but only at E14.5 and E16.5 (B,C). (D–F’) In Emx2-/- utricles, the regional differences of EdU labeling are similar to the controls. (H) A subdivision of the utricle into the oncomodulin-positive, striola (blue), LES (green) and MES (pink) domains. The red dotted line joining the two ends of the striola was used as an arbitrary division between the two ends of LES and MES. (I–I”) Triple labeling of the utricle with anti-Myosin VIIa (red), anti-oncomodulin (blue) and EdU (green). HCs that are triple-labeled (yellow arrowhead), EdU-positive HCs (white arrow) and EdU-positive non-HCs (blue arrow) are marked. (J) No significant differences in percentages of EdU-labeled HCs are observed between various regions of the Emx2+/- and Emx2-/- utricles (Figure 3—source data 1). Blue, green and pink lines represent the percentages of EdU-positive HCs in the striola, LES, and MES, respectively. Both Emx2 heterozygous and knockout utricles show the peak of EdU-positive HCs detected at E11.5 for the striola and MES, and at E13.5 for the LES.
DOI: http://dx.doi.org/10.7554/eLife.23661.009

