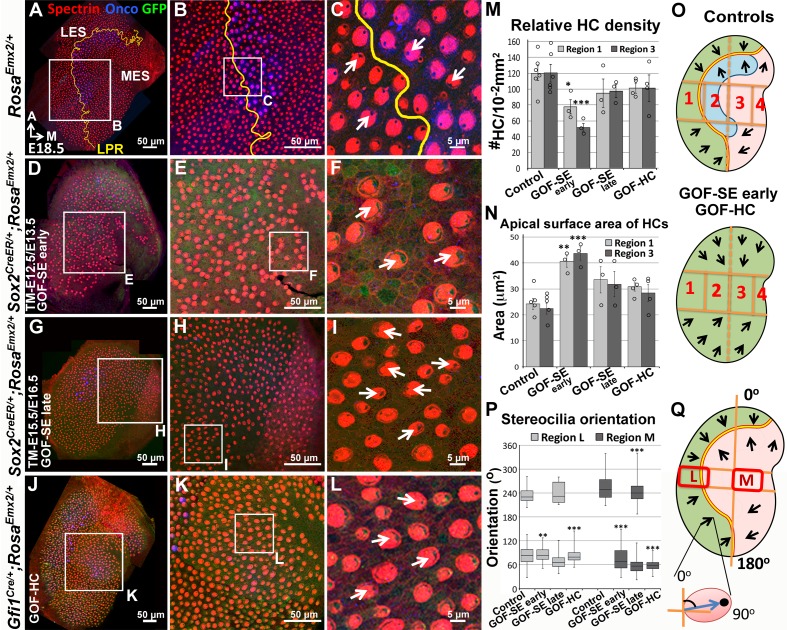
Figure 4. Ectopic Emx2 reverses hair bundle polarity in the utricle.
Compared to the medial side of the LPR in controls (A–C), hair bundle polarity (arrows) in the medial region of Sox2CreER/+;RosaEmx2/+ (D-F, tamoxifen given at E12.5 and E13.5, gain-of-function (GOF) in the sensory epithelium (SE), GOF-SE early; n = 3) and Gfi1Cre/+;RosaEmx2/+ utricles (J-L, GOF-HC (hair cell); n = 7) are reversed. (G–I) Sox2CreER/+;RosaEmx2/+ utricles (tamoxifen give at E15.5 and E16.5, GOF-SE late) show a mixed phenotype of normal and reversed bundle polarities (white arrows, n = 3). Among the GOF specimen (D,G,J), anti-oncomodulin staining (blue) is only sparsely detectable in the GOF-HC utricles (J) compared to controls (A). (M–N) Quantification of HC density (M; Figure 4—source data 1) and surface area (N; Figure 4—source data 2) in Regions 1 and 3 of utricles from various genotypes (controls, n = 6; GOF-SE, n = 3; GOF-HC, n = 4). Only utricles of GOF-SE early show a significant decrease in HC density and an increase in the apical surface area of HCs compared to controls. Error bars represent SEM. *p<0.05; **p<0.01; ***p<0.001. (O) Schematic diagrams illustrating hair bundle polarity pattern and defined regions in control and Emx2 gain-of-function utricles. (P–Q) Box-plots of hair bundle polarity in regions L (LES) and M (MES) of utricles (Figure 4—source data 3). Region L of controls includes the LPR and thus show HCs with both medial and lateral polarities but only medial-pointing hair bundles are present in all Emx2 GOF utricles except GOF-SE late (control, n = 6; mutant, n = 3). Box represents quartiles 1 to 3. The line within the box is the median and the bar represents maximum and minimum number. **p<0.01, ***p<0.001, compared to controls.
DOI: http://dx.doi.org/10.7554/eLife.23661.011

