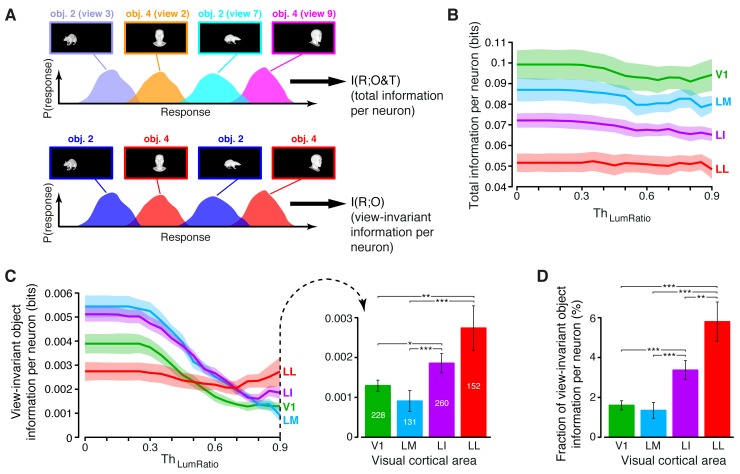
Figure 4. Comparing total visual information and view-invariant object information per neuron.
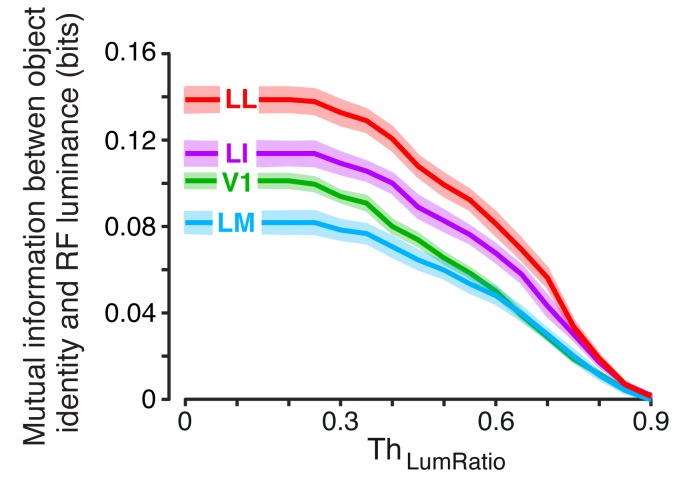
(A) Illustration of how total visual information and view-invariant object information per neuron were computed, given an object pair. In the first case, all the views of the two objects were considered as different stimulus conditions, each giving rise to its own response distribution (colored curves). In the second case, the response distributions produced by different views of the same object were merged into a single, overall distribution (shown in blue and red, respectively, for the two objects). (B) Total visual information per neuron (median over the units recorded in each area ± SE) as a function of the similarity between the RF luminance of the objects in each pair, as defined by (see Results). (C) Left: view-invariant object information per neuron (median ± SE) as a function of . Right: view-invariant object information per neuron (median ± SE) for (*p<0.05, **p<0.01, ***p<0.001; 1-tailed U-test, Holm-Bonferroni corrected). The number of cells in each area is written on the corresponding bar. (D) Ratio between view-invariant object information and total information per neuron (median ± SE), for . Significance levels/test as in (C). The invariant object information carried by RF luminance as a function of is reported in Figure 4—figure supplement 1.


