Figure 1.
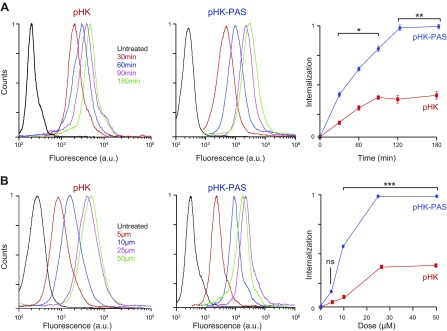
Quantification of cellular uptake of pHK and pHK-PAS. A) Time course of peptide internalization. HeLa cells were incubated with 25 µM pHKA488 (left) or pHK-PASA488 (middle) in serum-free DMEM for 30–180 min. B) Dose dependence of peptide internalization. HeLa cells were incubated with 5–50 µM pHKA488 (left) or pHK-PASA488 (middle) in serum-free DMEM for 2 h. After peptide incubation, cells were washed 3 times with ice-cold PBS, trypsinized, centrifuged, and resuspended in ice-cold PBS with 10% FBS, and fluorescence was measured by FACS. Peptide internalization was determined by subtraction of background signal (cells treated with vehicle alone) from fluorescence intensities of peptide-treated cells and plotted relative to the maximum fluorescence intensity observed (right). (Error bars lie within the symbol for some data points.) ns, nonsignificant (P > 0.05). *P < 0.01, **P < 0.001, ***P < 0.0001 compared with pHK.

