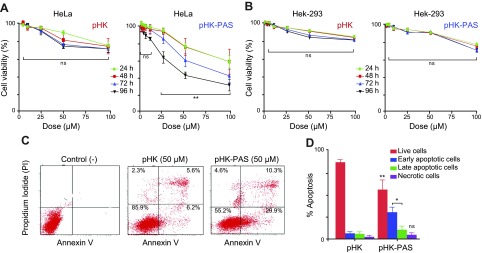
Figure 5.
Complementary measures of the cytotoxic effects of pHK and pHK-PAS. A, B) Dose- and time-dependent inhibition of MTS reduction. HeLa (A) and HEK293 (B) cells were treated with the indicated concentrations of pHK (left) or pHK-PAS (right) for the indicated durations. Cells that were treated with peptide-free carrier were used as control. The percent viability was determined form the ratio of the absorbance of treated cells to control cells. (Error bars lie withing the symbol for some data points.) C, D) Detection of apoptosis and necrosis. C) FACS analysis of annexin V/PI staining of HeLa cells that were either untreated (control; left) or treated with 50 μM pHK (middle) or pHK-PAS (right) for 24 h. The bottom left quadrant (annexin V−/PI−) represents live cells; bottom right (annexin V+/PI−), early apoptotic cells; top right (annexin V+/PI+), late apoptotic cells; and top left (annexin V−/PI+), necrotic cells. D) A summary of the incidence of early and late apoptosis and necrosis in HeLa cells that were treated with pHK (left bars) or pHK-PAS (right bars) determined from FACS analysis of annexin V/PI staining in panel C. ns, nonsignificant (P > 0.05). *P < 0.01, **P < 0.001 compared with pHK.

