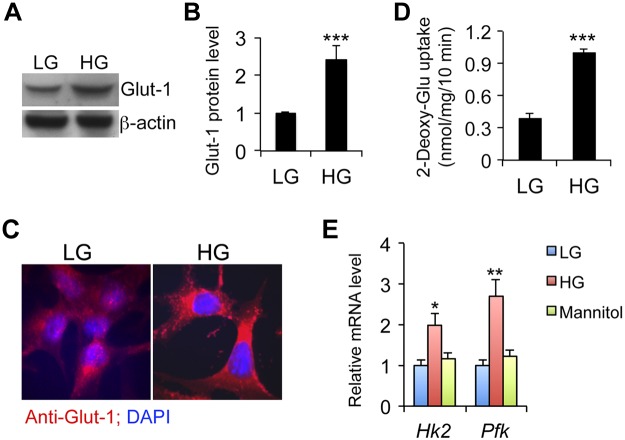
Figure 4.
HG promotes Glut-1–mediated glucose influx in MCs. A, B) Western blot analysis (A) and densitometric quantitation (B) of Glut-1 protein levels at 24 h after HG exposure. C) Glut-1 expression (red) measured by immunostaining at 24 h. Nuclei are stained with DAPI (blue). D) [3H]-2-Deoxy-d-glucose uptake assays. E) Real time RT-PCR quantitation of hexose kinase 2 (Hk2) and phospho-fructose kinase (Pfk) gene transcripts in MCs exposed to LG, HG, or high mannitol for 24 h. *P < 0.05; **P < 0.01; ***P < 0.001 vs. LG.

