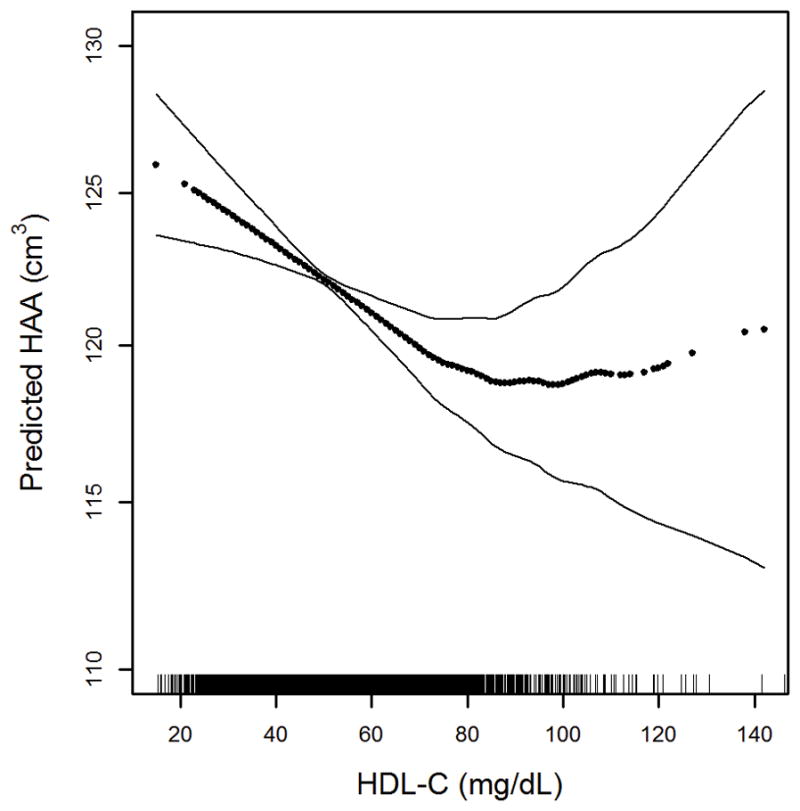
Figure 1.

Continuous association between HDL-C and HAA adjusted for age, gender, race/ethnicity, educational attainment, height, body mass index, waist circumference, smoking status, cigarette pack-years, presence of hypertension, presence of diabetes, low density lipoprotein,, triglycerides, c-reactive protein, interleukin-6, glomerular filtration rate, statin use, diuretic use, coronary artery calcium, study site, milliAmpere dose, total volume imaged lung, percent emphysema on CT, left ventricular ejection fraction and left ventricular end-diastolic mass; p for nonlinearity 0.009, p for association <0.001. Dark dotted line is the continuous association. Thin solid lines are the 95% confidence bands. Each point in the graph and each vertical hashmark in the rug plot along the x-axis represent one study participant.
