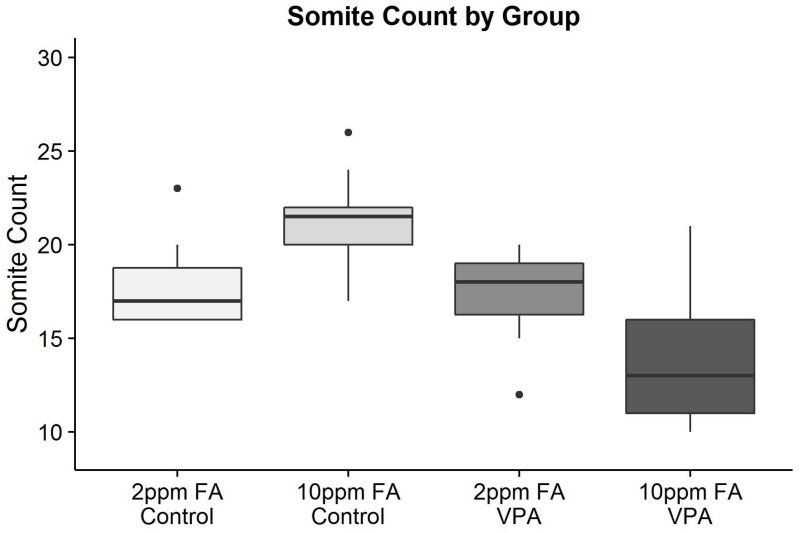
Figure 2.
Boxplots depicting the somite count of murine embryos in each of the four treatment groups included in the LC/MS metabolomics analysis. All pairwise comparisons are statistically significant with the exception of 2ppm FA Control and 2ppm FA VPA (n = 18 for each group). Exact differences in somite count and p-values can be found in Supplementary Table 1.

