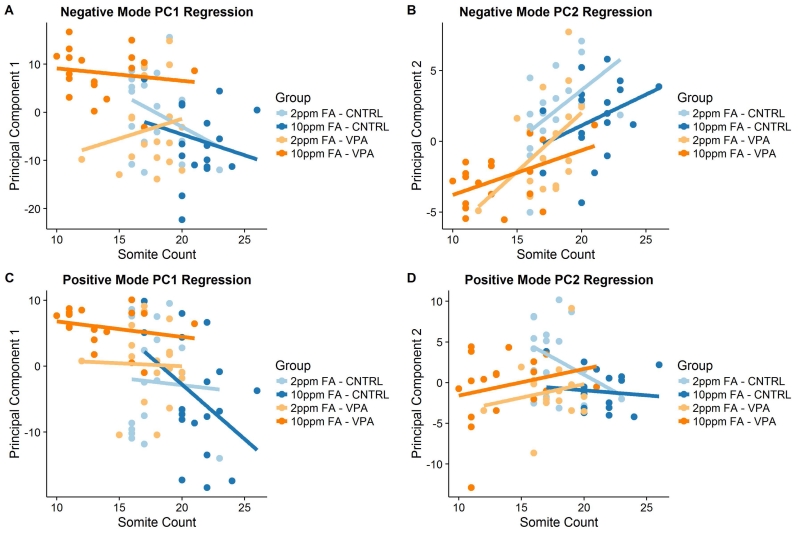
Figure 3.
Principal component (PC1 and PC2) regression onto somite counts for control and VPA-exposed mouse embryos from dams receiving a diet containing either 2ppm or 10ppm FA. (A) PC1 based on negative mode data (59.9% of all variance explained), no significant regression or meaningful R2 for any group. (B) PC2 based on negative mode data (7.6% of all variance explained), 2ppm FA – CNTRL R2 = 0.23, no significant regression for the 10ppm FA – CNTRL group, 2ppm FA – VPA R2 = 0.24, 10ppm FA – VPA R2 = 0.22. (C) PC1 based on positive mode data (49.5% of all variance explained), no significant regression or meaningful R2 for any group. (D) PC2 based on positive mode data (13.4% of all variance explained), no significant regression or meaningful R2 for any group. (n = 18 embryos for each group.)

