Figure 4.
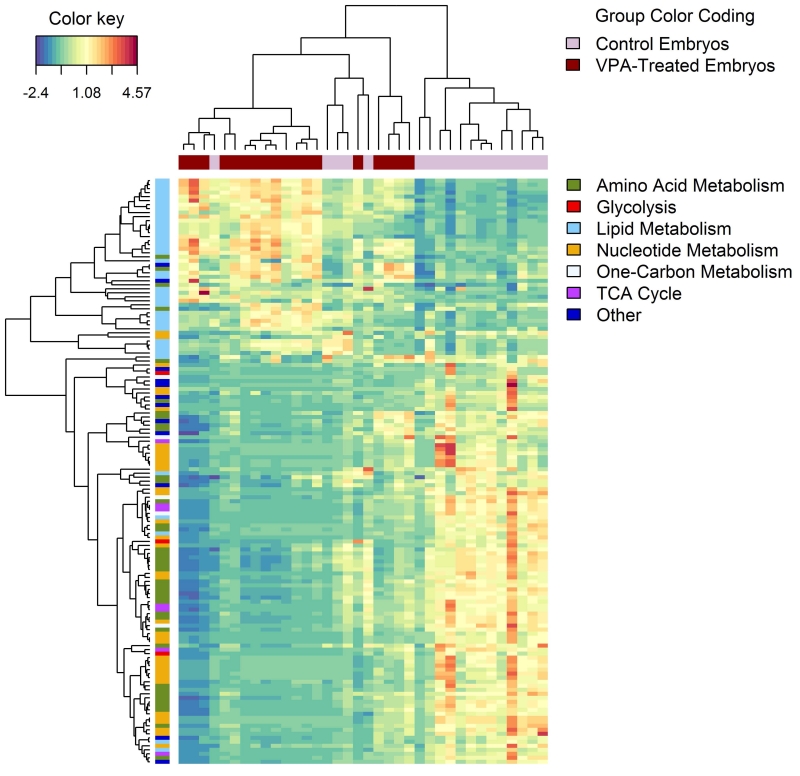
Untargeted hierarchical clustering plot demonstrating alterations in the relative abundances of compounds in embryos from VPA-treated vs. control dams receiving a diet containing10ppm FA. Depicted results were represented as a heat map based on compounds identified with negative-ion mode LC/MS analysis. In this data representation, metabolites are clustered in the rows and 10ppm FA control and VPA-exposed embryos are clustered in the columns. Pearson correlation and complete linkage was used to cluster both columns and rows. Compounds in the rows are also marked by major compound classifications. (n = 18 embryos for each group.)

