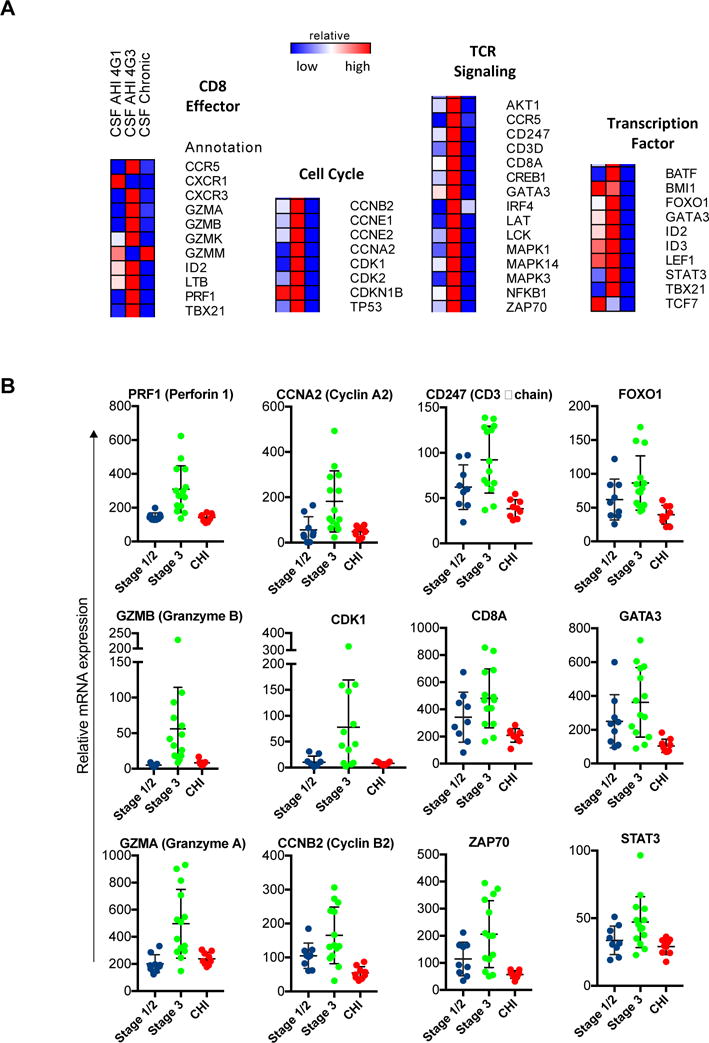
Fig 3. Gene expression of CD8+ T cells in the CSF of acute and chronic HIV infected participants.

A. Targeted gene expression profile of 96 genes by multiplex qPCR involved in cell cycle, transcription factors, CD8 effector functions, and TCR signaling pathways for the CD8+ T cells in the CSF of AHI stage ½ (n=9), AHI stage 3 (n=14), and CHI (n=9) participants compared to uninfected participants (n=6). Scale represents fold change in gene expression of 100 total CD8+ T cells in the analyzed group compared to uninfected participants. Forty-two genes were significantly different (p<0.05) are displayed in heatmap based on one-way ANOVA with Geisser-Greenhouse correction and Tukey-Kramer’s post-hoc test. B. Graphs represent relative mRNA expression for individual subjects for select genes from each pathway. AHI: acute HIV-infection, CHI: chronic HIV-infection.
