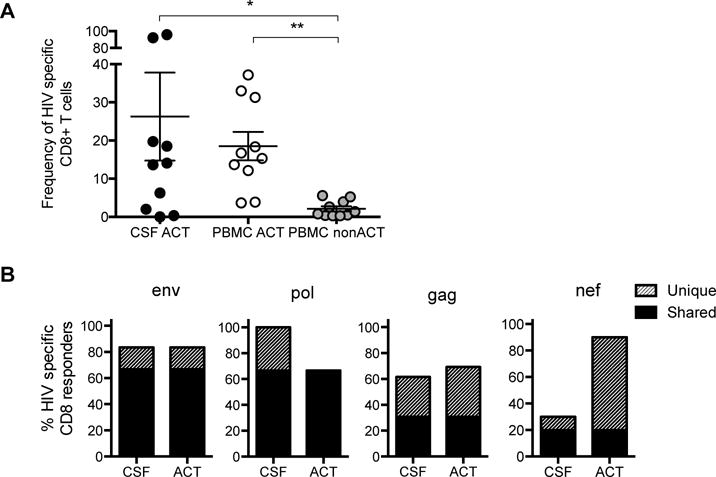
Figure 5. Frequency of HIV-specific CD8+ T cells in the CSF and PBMCs in acute HIV infection.

A. Frequency of activated CD8+ T cells from AHI stage 3 participants (n=10) expressing IFNγ in response to stimulation with Gag, Pol, Env, and Nef in activated CD8+ T cells in the CSF (CSF ACT), activated CD8+ T cells in the periphery (PBMC ACT), and non-activated CD8+ T cells in the periphery (PBMC non-ACT), *p<0.05, **p<0.005. B. Frequency of HIV-specific CD8+ T cells that responded to peptide pool stimulation (4-5 pools per HIV protein) in the CSF and activated PBMCs (ACT) by measuring IFNγ production. Grey bar color represents HIV-specific CD8+ T cell responses that were unique to either the CSF or PBMCs and black represents responses that were shared by both compartments.
