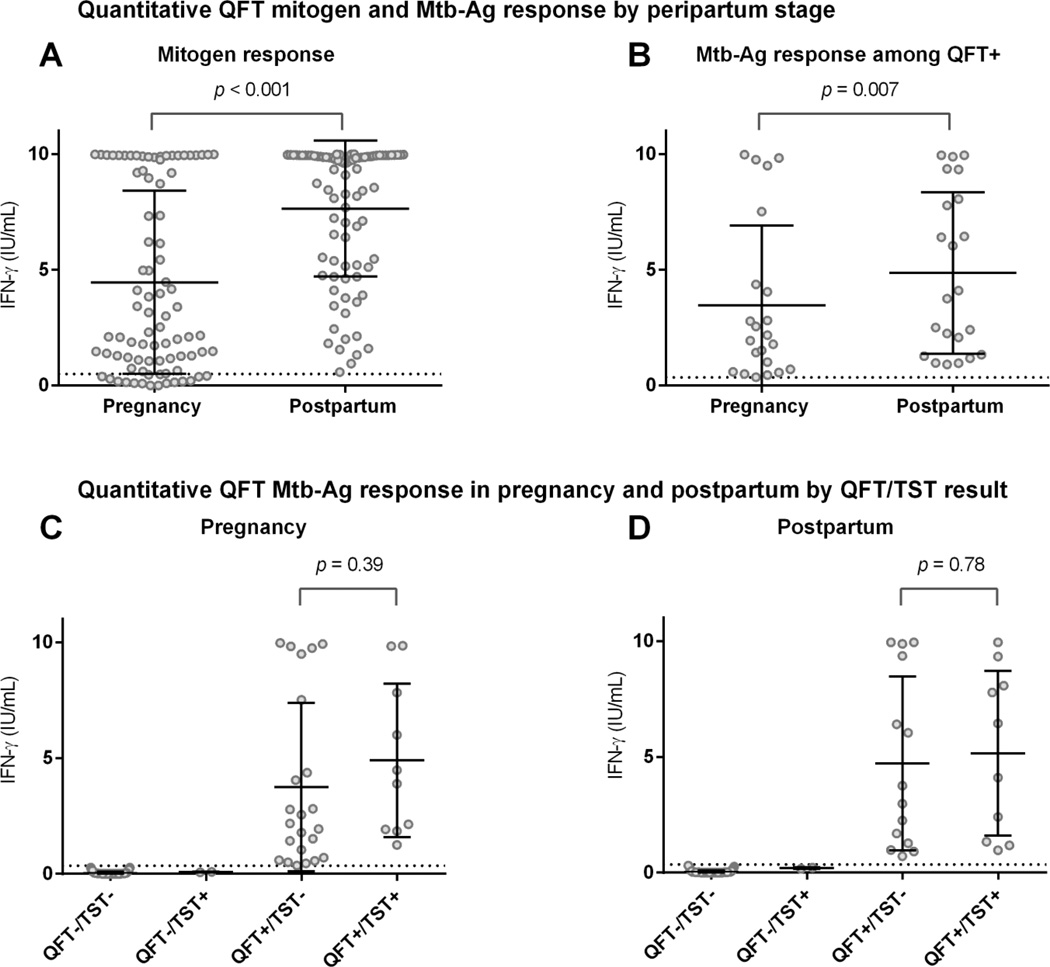
Figure 3. Quantitative QFT mitogen and Mtb-Ag response by peripartum stage and QFT/TST result.
Panel A: Comparison of mean quantitative QFT mitogen response between pregnancy and postpartum among all women tested at both time points (n=86). The dotted line represents the cut-off for mitogen responses (0.50 IU/ml), below which are considered to be indeterminate by QFT manufacturer recommendations. There were 14 women tested at both time points with indeterminates in pregnancy with no indeterminates postpartum. Mean mitogen response was significantly lower during pregnancy compared to postpartum (4.46 vs. 7.64 IU/ml, p<0.001). Panel B: Comparison of quantitative QFT Mtb-Ag response between pregnancy and postpartum among women who remained QFT+ at both time points (n=22). The dotted line represents the cut-off for QFT+ responses (≥ 0.35 IU/ml). Mean QFT Mtb-Ag response was significantly lower during pregnancy compared to postpartum (3.46 vs. 4.48 IU/ml, p=0.007). Panels C & D: Comparison of mean QFT Mtb-Ag response by combined QFT/TST results in pregnancy and postpartum. Mean QFT Mtb-Ag response was not statistically significantly higher among QFT+/TST+ compared to QFT+/TST− in both pregnancy and postpartum, but considerably above the ≥0.35 IU/mL positive threshold (represented by the dotted line). For all panels the solid lines indicate mean and 95% CI. Mtb-Ag indicates Mtb-Ag minus nil and mitogen indicates mitogen minus nil as calculated per manufacturer recommendations.

