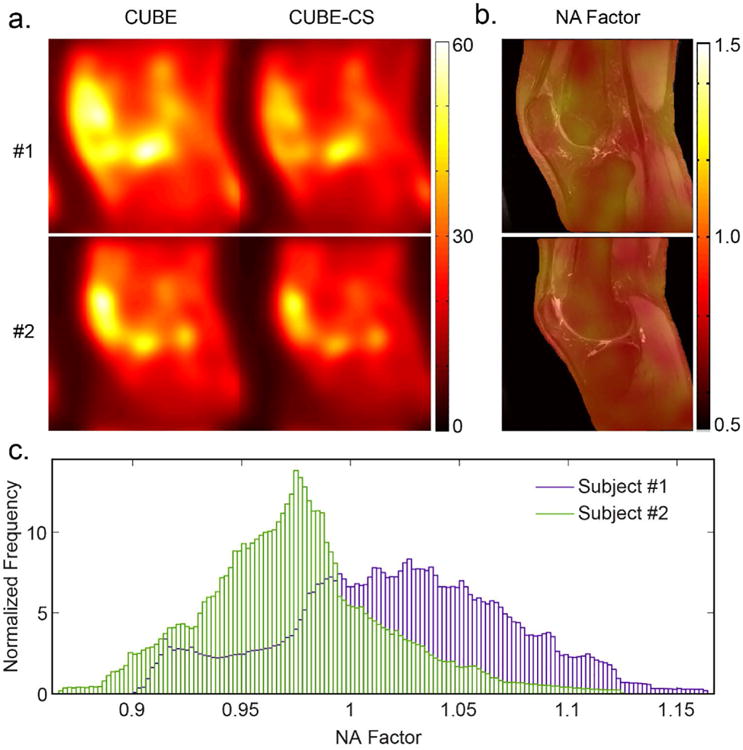
Figure 2.

(a) Estimated low frequency noise standard deviation maps for two healthy volunteers (#1 a central sagittal slice through the middle of the knee joint in a 30 year old male and #2 a sagittal slice through the lateral femoral condyle in a 29 year old female) for CUBE and CUBE-CS and corresponding (b) Color-coded noise amplification NA factor maps superimposed on top of the CUBE source image. (c) NA factor histograms show different noise amplification distribution for these two subjects but both histograms have mean value close to 1 indicating no noise amplification.
