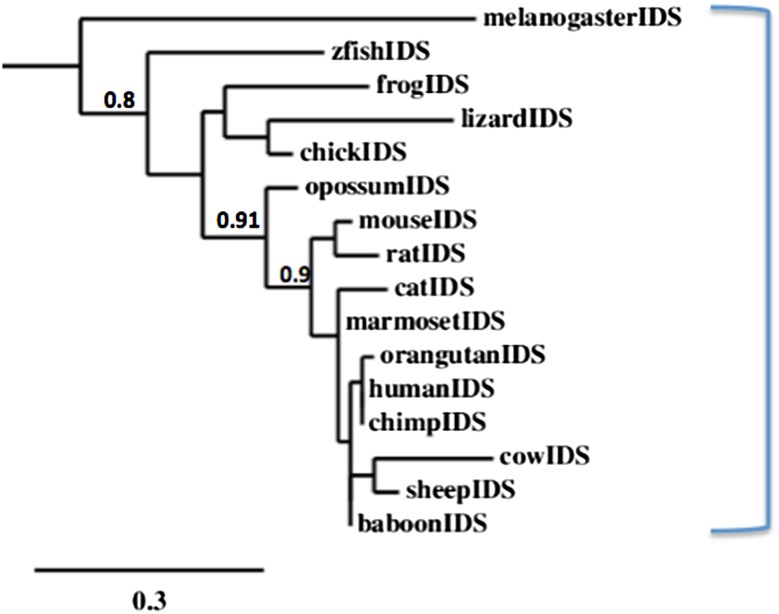
Fig. 6.
Phylogenetic tree of vertebrate IDS amino acid sequences. The tree is labeled with the vertebrate and fruit fly IDS. A genetic distance scale is shown. The number of times a clade (sequences common to a node or branch) occurred in the bootstrap replicates are shown. Replicate values of .9 or more which are highly significant (values of .9 or more), are shown with 100 bootstrap replicates performed in each case

