
Fig. 1.
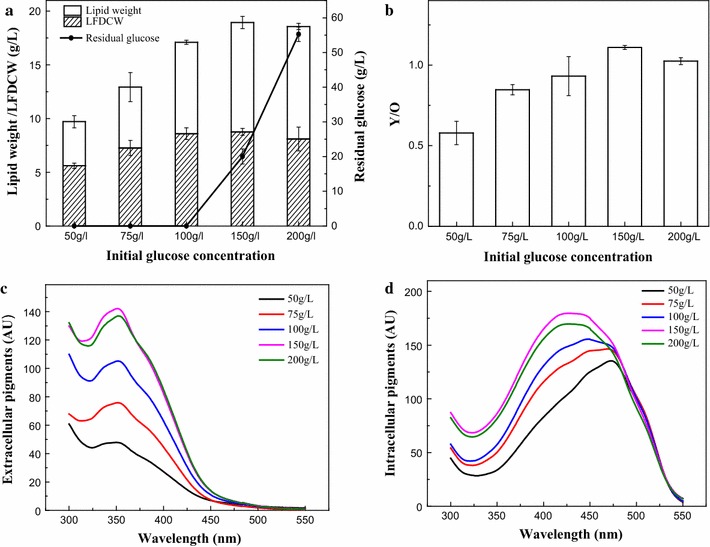
Metabolism of lipid and pigments with IGC of 50, 75, 100, 150 and 200 g/L. a Lipid weight (g/L), LFDCW (g/L) and residual glucose (g/L). b Ratio of intracellular yellow to orange pigments (Y/O).c Spectra of extracellular pigments. d Spectra of intracellular pigments