Fig. 1.

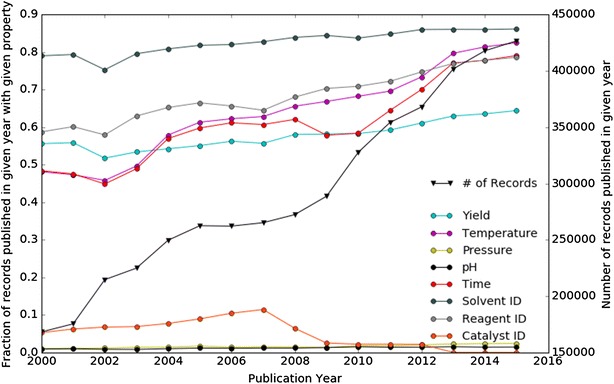
Plot of the number of records added to Reaxys in a given year and their information content when analysing a fixed set of properties. The “# of Records” line is plotted against the right-hand side y-axis

Plot of the number of records added to Reaxys in a given year and their information content when analysing a fixed set of properties. The “# of Records” line is plotted against the right-hand side y-axis