Figure 3.
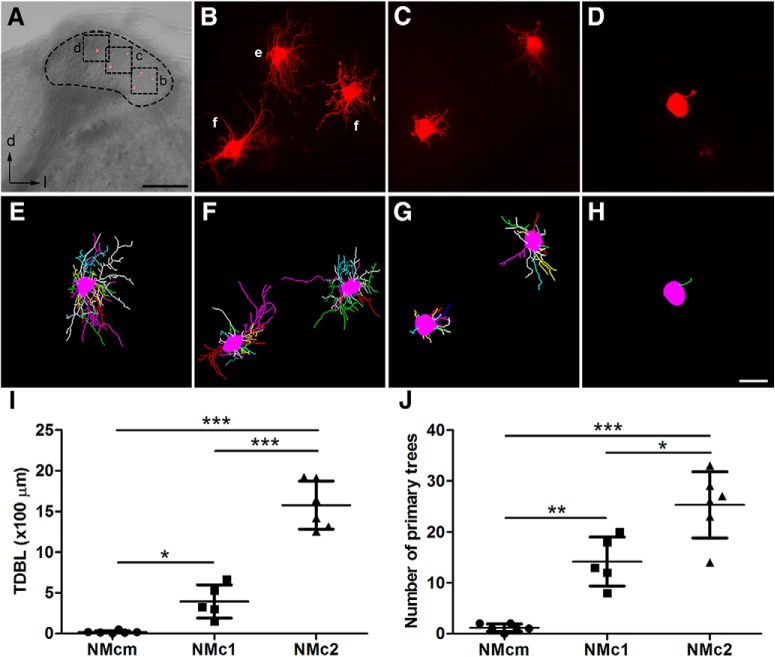
Single-cell dye-filling shows different dendritic morphology in NMcm, NMc1, and NMc2. A, An example slice containing several filled neurons in different subregions along the lateral-to-medial axis. The black dashed circle outlines NM. Cell bodies of the filled neurons (red) are evident in this low-magnification image. B–D, Higher magnification of the boxes in A showing maximum z-projection of filled neurons in NMc2 (B), NMc1 (C), and NMcm (D). E, F, 3D reconstruction of the filled neurons in B. G, 3D reconstruction of the filled neurons in C. H, 3D reconstruction of the filled neuron in D. I, Quantitative analysis of the total dendritic branch length. J, Quantitative analysis of the number of primary trees. ***, P < 0.001; **, P < 0.01; *, P < 0.05. Data are presented as mean ± SD. Abbreviations: see Fig. 1. Scale bars = 200 μm in A and 20 µm in H (applies to B–H).

