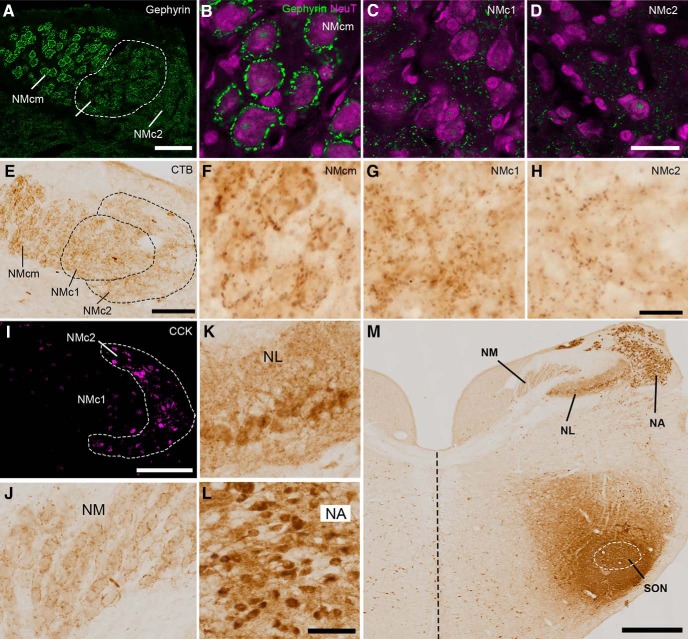
Figure 6.
NMc1 and NMc2 receive inhibitory inputs from SON. A–D, Distribution pattern of inhibitory synaptic marker gephyrin. NMc1 is outlined by dashed line. B–D are high-magnification observations of NMcm (B), NMc1 (C), and NMc2 (D), respectively. E–H, Anterogradely labeled axonal terminals in the caudal NM after in vivo injection of CTB into SON. Dashed lines outline NMc1 and NMc2. F–H are high-magnification observations of NMcm (F), NMc1 (G), and NMc2 (H), respectively. I, Immunostaining of CCK performed on the adjacent section of E for identifying NMc2. J, Labeled axonal terminals in NM at the level more rostral than NMc. K, L, Labeled cell bodies and neuropil in NL (K) and NA (L). M, Injection site in SON. White dashed line indicates the approximate border of the SON. The midline is indicated by black dashed line. Abbreviations: CTB, cholera toxin B; SON, superior olivary nucleus. Other abbreviations: see Fig. 1. Scale bars = 100 μm in A, E, I; 50 μm in L (applies to J–L); 20 μm in B (applies to B–D) and H (applies to F–H); and 500 μm in M.

