Figure 7.
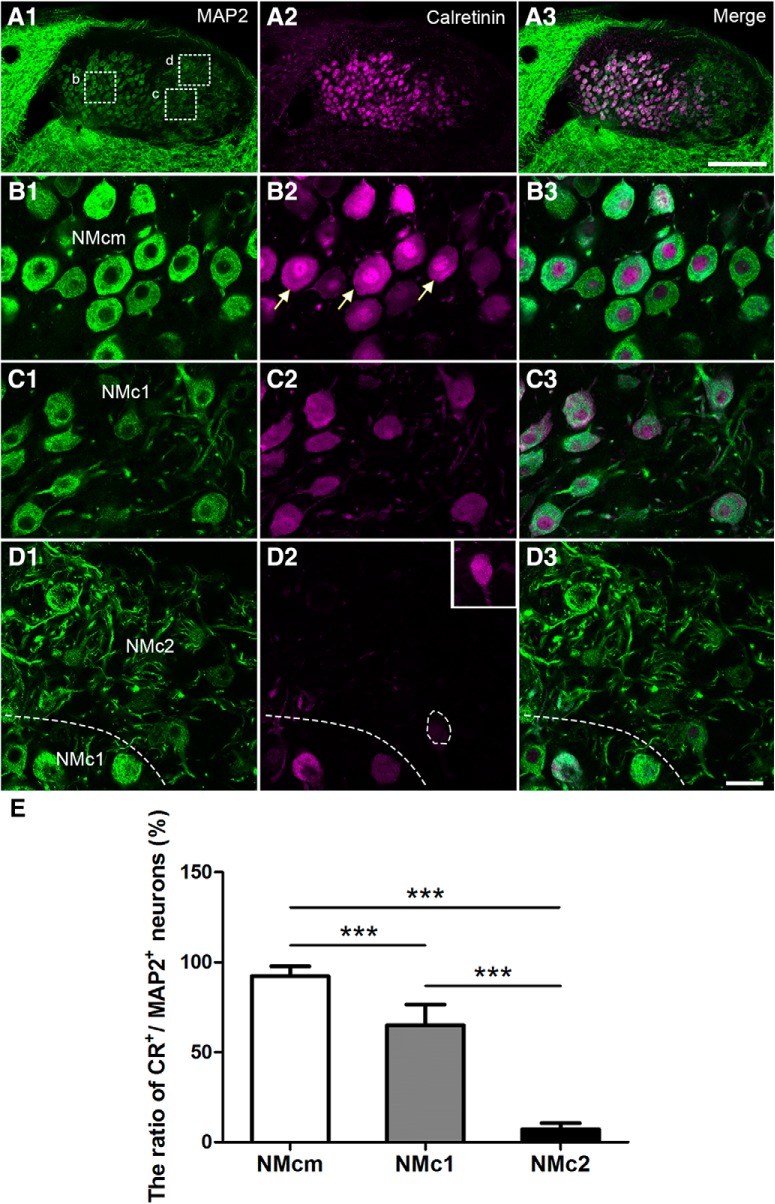
Differential expression of calretinin in the caudal NM. The left (A1, B1, C1, D1) and middle (A2, B2, C2, D2) columns are MAP2 and calretinin immunostaining, respectively. The right column (A3, B3, C3, D3) is the merged images. A, Low-magnification images were taken from a section at the level of Fig. 1G. B–D, High-magnification images of the boxes in A1. All images were collected with the same imaging parameters and processed in the same way, except for the inset in D2 in which the brightness is enhanced to show a weakly labeled neuron in NMc2. Note calretinin-expressing neurons in NMcm and NMc1, but not NMc2. The border between NMc1 and NMc2 is indicated by dashed lines in D. E, Bar chart of the ratio of calretinin-expressing neurons in NMcm, NMc1, and NMc2. ***, P < 0.001. Data are presented as mean ± SD. Abbreviations: see Fig. 1. Scale bars = 100 μm in A3 (applies to A1–A3) and 20 μm in D3 (applies to B1–D3).

