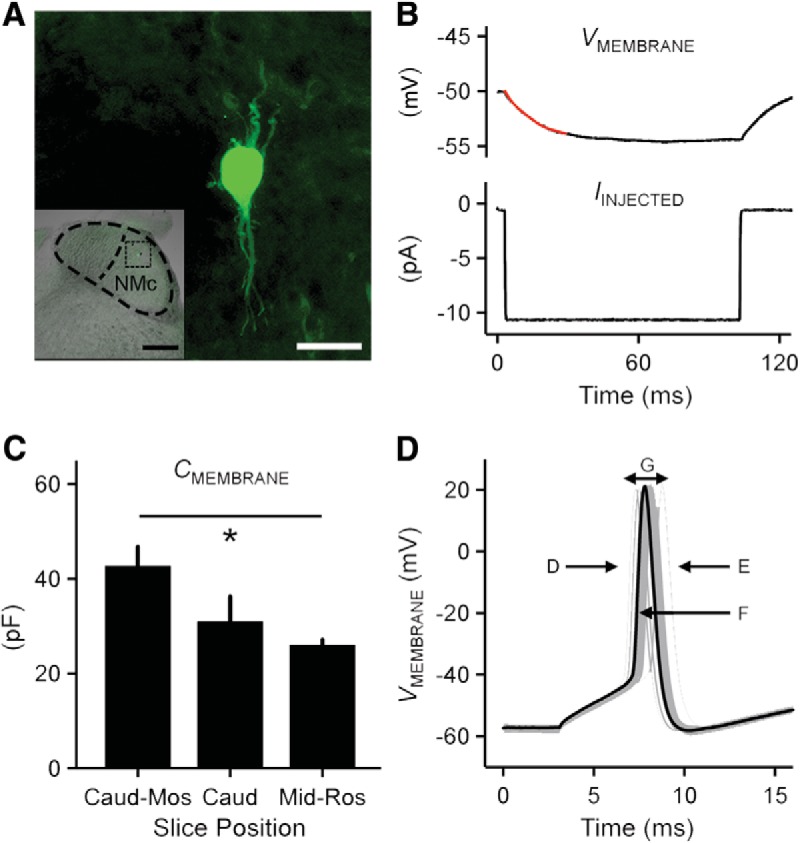
Figure 9.

Electrophysiological protocols applied to NMc1 and NMc2 neurons. A, Neurobiotin-labeled NMc1/NMc2 neuron. Inset shows low-magnification image of the entire coronal NM region with the labeled NMc1/NMc2 neuron. Dorsal, top; lateral, right. Scale bar = 20 μm (200 μm in inset). B, Current clamp protocol to measure passive membrane properties. Upper trace shows the representative voltage response (average of 30 repetitive trials) recorded from an NMc1/NMc2 neuron in response to a hyperpolarizing current injection (lower trace, –10 pA). A single exponential was fitted to a 30-ms time window after the current injection (superimposed red line), to calculate time constant (tau), input resistance, and membrane capacitance. C, Population data showing membrane capacitance (CMEMBRANE) sampled from the first (also referred as caudomost [caud-mos]) slice, second/third slices (caud), and middle to rostral slices (mid-ros, mid- to high-frequency NM; data modified from Hong et al. [2016]). Asterisk represents significance at p < 0.05. Error bars show SE. D, Metrics used to measure AP properties. Representative first APs (30 superimposed trials) were recorded from an NMc1/NMc2 neuron in response to current injections with the strength 25% above the threshold current (duration 100 ms). Several AP properties were characterized: rise rate (D), fall rate (E), half width (F), and reliability range (G). Population data of AP properties are shown in the corresponding panels in Fig. 11.
