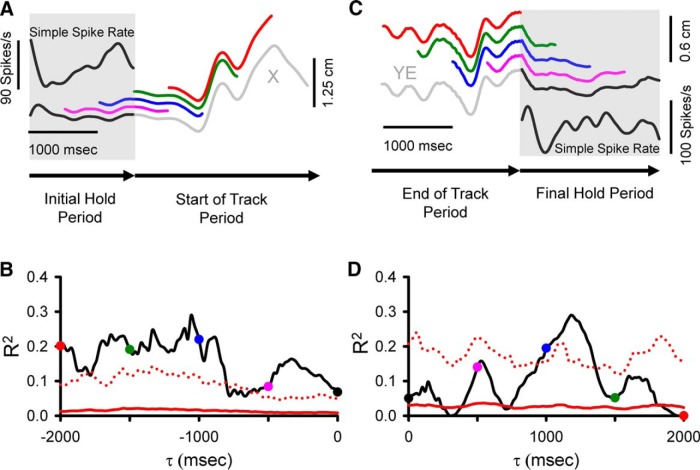
Figure 10.
Analyses used to correlate simple spike activity during the hold periods with the behavior parameters. A, Simple spike firing (upper left inset) from a single trial during the initial hold period (gray shadow) is correlated with X-position at different τ values from 0 to -2000 ms using a sliding window of the same width as the initial hold period. Colored traces illustrate X-position at τ = 0 ms (black), τ = -500 ms (pink), τ = -1000 ms (blue), τ = -1500 ms (green), τ = -2000 ms (red). B, For the same cell in A, the R2 temporal profile from the regression with X across all trials as a function of τ. C, Simple spike firing (lower right inset) from a single trial during the final hold period (gray shadow) is correlated with position error (YE) recorded in both track (gray segment) and final hold (black segment) periods using a sliding window with the same width as the final hold period moving from 0-2000 ms. Colored segments illustrate the sliding window at τ = 0 ms (black), τ = 500 ms (pink), τ = 1000 ms (blue), τ = 1500 ms (green), τ = 2000 ms (red). D, For the same cell as in C, the R2 temporal profile from the regression with YE encoding across all trials as a function of τ. Arrows at the bottom of A and C indicate direction of recording time. B, D, Colored dots coded the same as in A and C, respectively. Conventions for τ values, and denotation of chance encoding are as in Figure 2.

