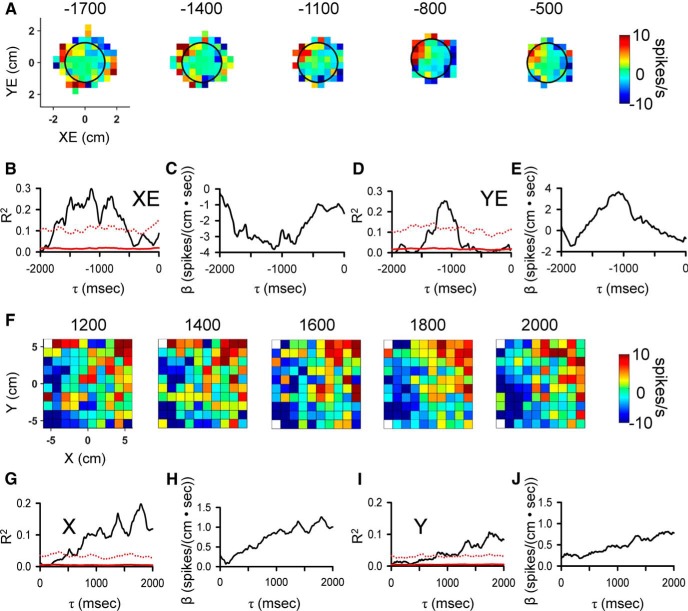
Figure 11.
Purkinje cell simple spike modulation during the hold periods in relation to errors and kinematics motor. A, Sequence of firing maps in 300-ms steps of the simple spike modulation in the initial hold with error position. B, D, R2 temporal profiles show the strength of XE and YE encoding as function of τ value for this example recording. C, E) β temporal profiles show corresponding simple spike sensitivity during the initial hold to XE and YE as a function of τ value. F, Sequence of firing maps in 200-ms steps of the simple spike modulation during the final hold with hand position for another Purkinje cell. G, I, R2 temporal profiles show the strength of X and Y encoding as function of τ value for this neuron. H, J, β temporal profiles show simple spike sensitivity to X and Y as a function of τ value. Color scheme of firing maps, τ values, and denotation of chance encoding are as in Figure 2.

