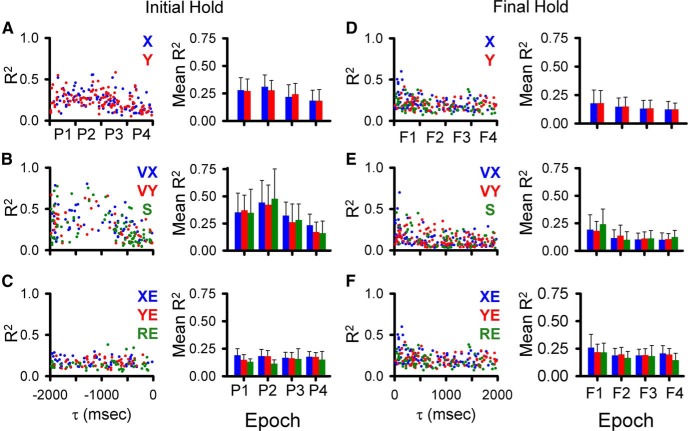
Figure 12.
Temporal distribution of peak and averaged R2 during the hold periods. A–C, Distribution of significant R2 peaks for the initial hold period for each parameter (left panels) and averaged R2 (right panels) for the predictive epochs. D–F, Distribution of significant R2 peaks for the final hold period for each parameter (left panels), and averaged R2 (right panels) in the feedback epochs. Epochs and color-code as in Figure 5.

