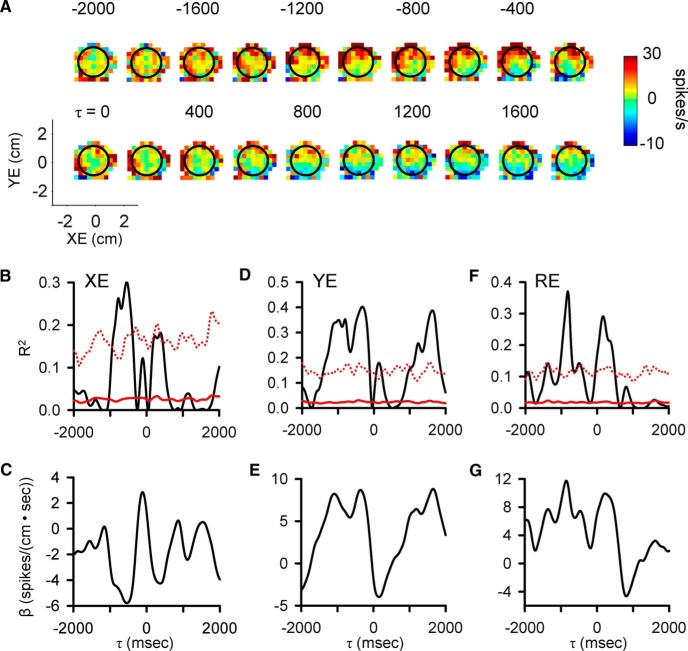
Figure 4.
Purkinje cell simple spike modulation in relationship to position error during track period. A, Sequence of firing maps showing simple spike modulation with position errors in 200-ms steps. B, D, F, R2 temporal profile shows the strength of XE, YE, and RE encoding as function of τ, respectively. C, E, G, β temporal profiles show the firing sensitivity to XE, YE, and RE as a function of τ, respectively. Color scheme of firing maps, τ values, and denotation of chance encoding as in Figure 2.

