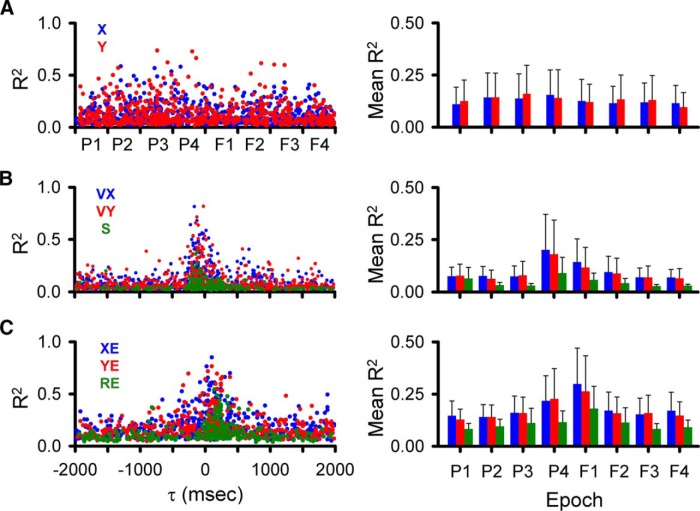
Figure 5.
Temporal distribution of simple spike peak and averaged R2 values during the track period. A, Distributions of significant R2 peaks for position (left panel) and averaged R2 (right panel) for each of the predictive and feedback epochs (X, blue; Y, red). B, Similar distributions of significant R2 peaks (left panel) and averaged R2 (right panel) for velocity (VX, blue; VY, red) and speed (S, green). C, Distributions of significant R2 peaks (left panel) and averaged R2 (right panel) for position error (XE, blue; YE, red) and radial errors (RE, green). Epochs are P1: -2000 to -1500 ms, P2: -1500 to -1000 ms, P3: -1000 to -500 ms, P4: -500-0 ms, F1: 0-500 ms, F2: 500-1000 ms, F3: 1000-1500 ms, F4: 1500-2000 ms. Same epochs are used in subsequent figures.

