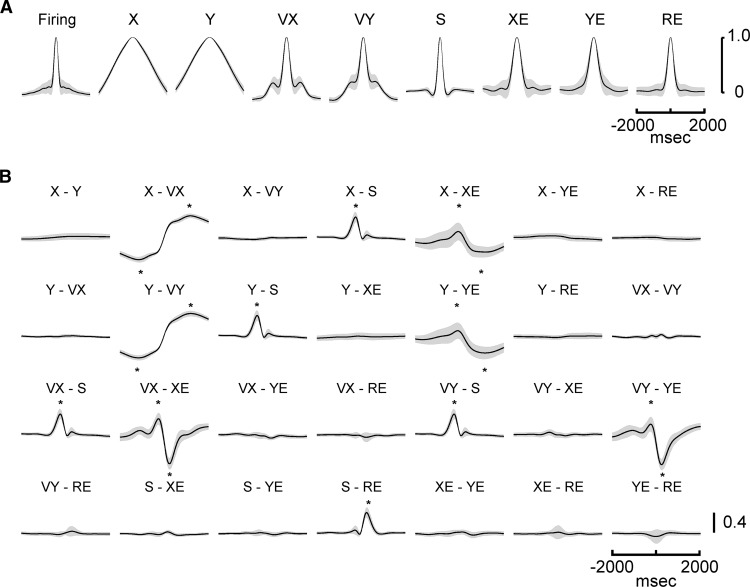
Figure 6.
Behavioral parameters temporal structure and interactions. A, Autocorrelograms of the simple spike firing and behavioral parameters. B, Cross-correlograms for all pairs of kinematic and error parameters. An * marks the time of a positive or negative correlation between parameters that exceeds a threshold of ρ < -0.1 or ρ > 0.1, respectively. Mean (solid line) ± SD (gray area) of autocorrelograms and cross-correlations computed over entire data set from the 183 Purkinje cells.

