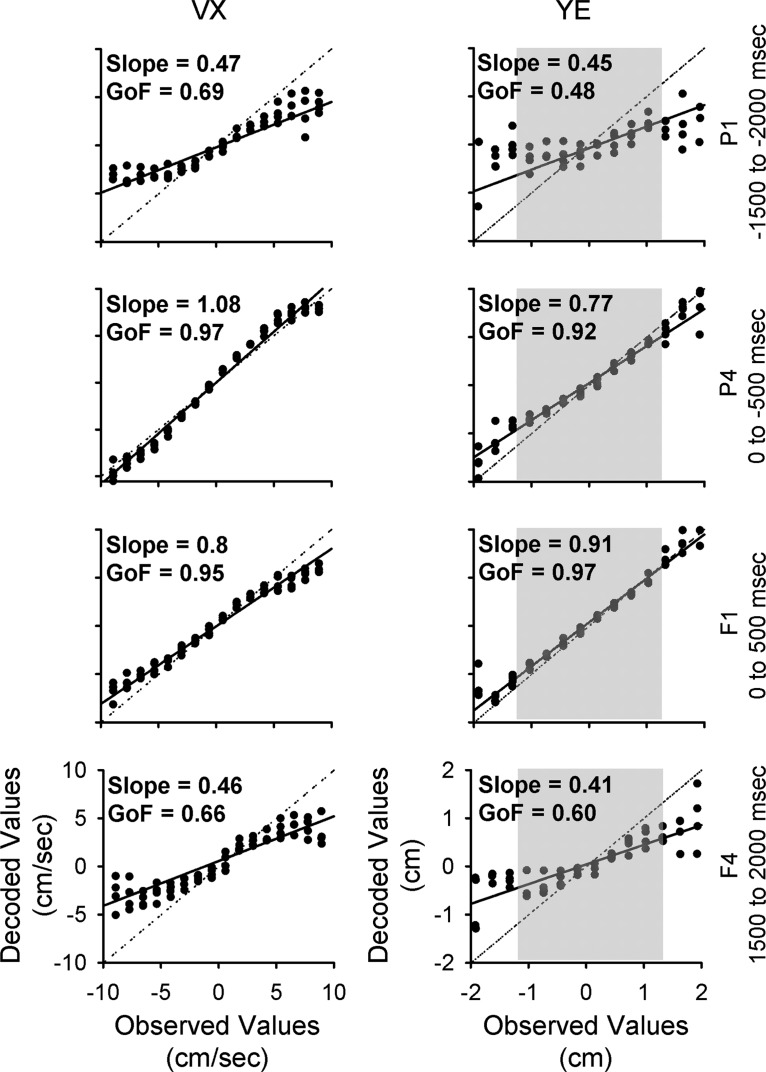
Figure 8.
Population decoding of VX and YE in different epochs. Distribution of decoded values versus observed values over 25 decoding repeats. The continuous lines illustrate the slope of each distribution. The dotted lines illustrate a slope of 1, corresponding to perfect decoding. In each row, the population decoding is performed using signals from a specific epoch (indicated on the right of each row). In the right column, the gray shaded region denotes the extent of the target.

