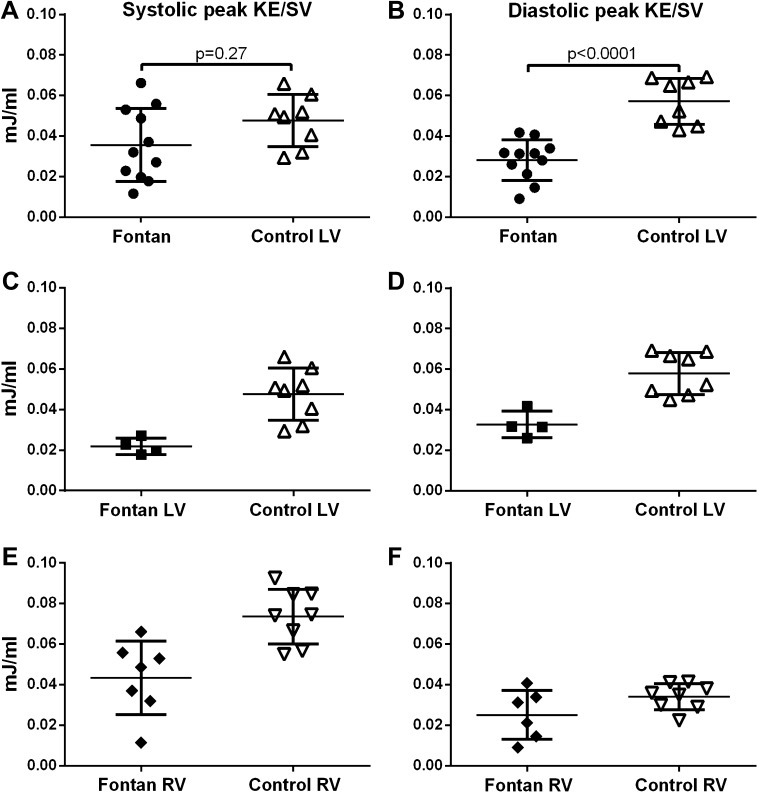
Fig. 3.
Kinetic energy (KE) indexed to stroke volume. The left column shows peak KE during systole and the right column peak KE during diastole. a and b shows all Fontan patients and the left ventricle in the control group. c and d shows Fontan patients with LV morphology and the left ventricle in the control group. e and f shows Fontan patients with RV morphology and the right ventricle in the control group. Error bars show mean ± SD

