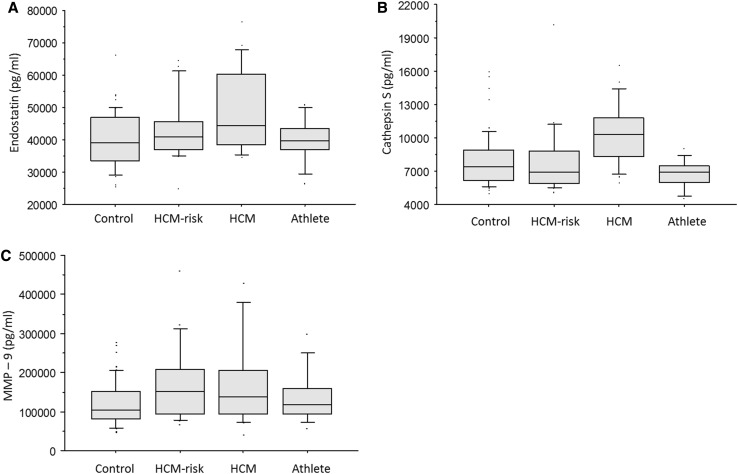
Fig. 1.
a Endostatin was higher in the HCM group than in controls (p = 0.0001), athletes (p = 0.005), and the HCM-risk group (p = 0.03). Data are shown as median and interquartile range. b Cathepsin S was higher in the HCM group than in controls (p = 0.0009), athletes (p = 0.0002), and the HCM-risk group (p = 0.02). Data are shown as median and interquartile range. c MMP-9 was higher in the HCM group than in controls (p = 0.008). There was no statistically significant difference between the HCM group and the other 2 groups (p = 0.1 vs. athletes, and p = 0.3 vs. the HCM-risk group). Data are shown as median and interquartile range.

