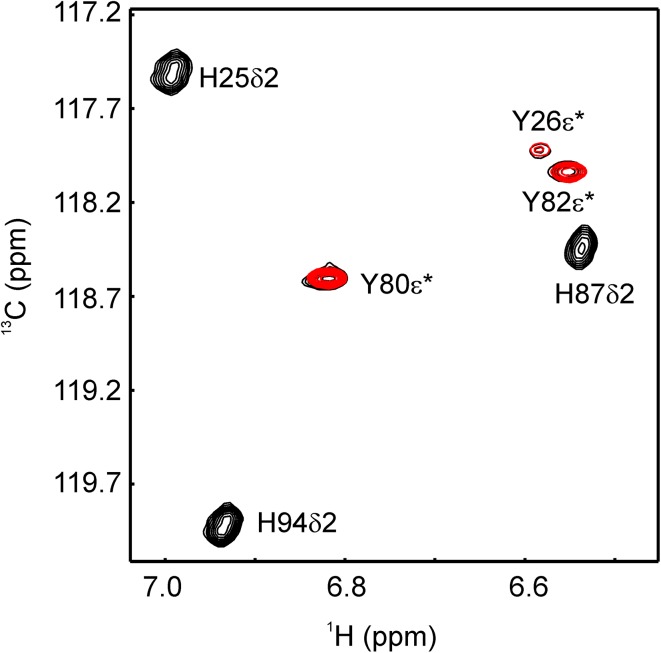
Fig. 3.
Tyr ε* His δ2 region of an aromatic 1H13C-TROSY-HSQC of FKBP12. Signals arising from a 2-13C1-glucose labeled sample are shown in black, while signals from a 1-13C1-erythrose labeled sample are shown in red. His δ2 signals are broadened because 15N was not decoupled. Asterisk represents an averaged signal of position 1 and 2 because of fast exchange of the aromatic rings on the NMR time-scale

