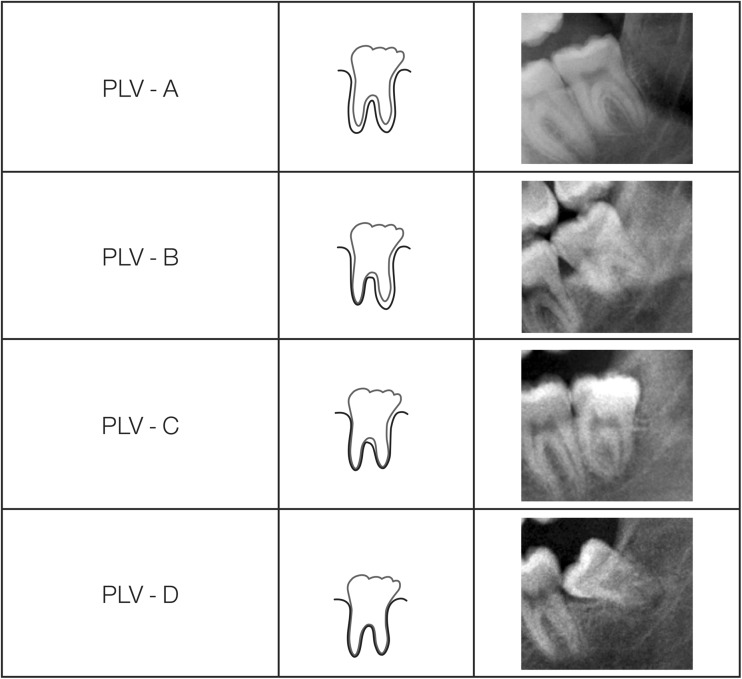
Fig. 1.
Schematic representations of the four grades of periodontal ligament visibility with examples of the radiographic representation of each RPV grade. Redrawn after Olze et al. 2010 [10], the appearances indicated in the schematic representations rarely appear with such a precise architecture. The diagrams represent the amount of visible periodontal ligament on the dental panoramic tomograph which is lost taken across the whole of the visible area of the mesial and distal roots combined and expressed as the area of the periodontal ligament that is no longer visible. This is essentially a form of pattern recognition. PLV-A = 100 % of periodontal ligament visible; PLV-B = 75 to 50 % of periodontal; ligament visible; PLV-C = 50 to 25 % of periodontal ligament visible; PLV-D = 0 % of periodontal ligament visible. It is helpful to enlarge the image using the computer software when making the assessments

