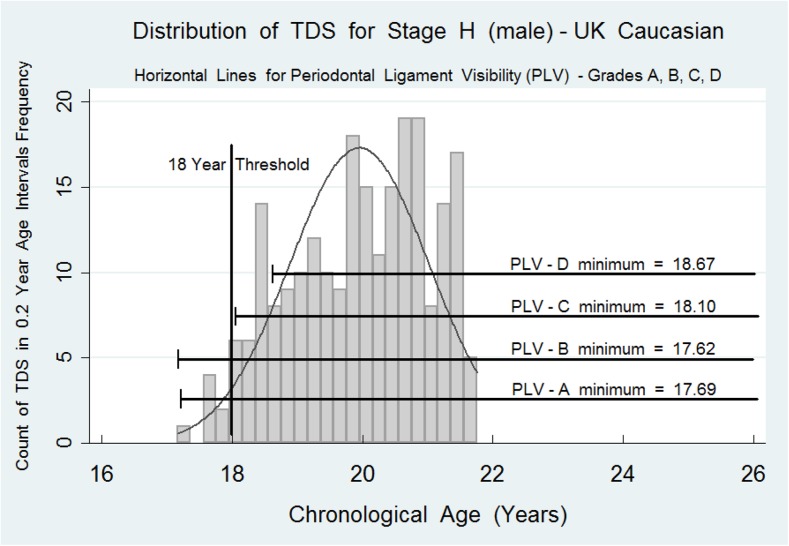
Fig. 3.
The histograms represent the probability distribution for the ages of attainment for tooth development stage H (the final stage of tooth development) for the lower third molar on the males. The data are censored at approximately 21.6 years for males. Superimposed are the horizontal data bars for PLV stages A, B, C, and D. The full summary data for these PLV stages in both females and males are shown in Table 1. The probability distribution curve for LLH f and m, respectively, is present as a background to the horizontal lines encompassing the data for PLV-A, PLV-B, PLV-C, and PLV-D. Minimal data has been entered on the graphs to avoid clutter

