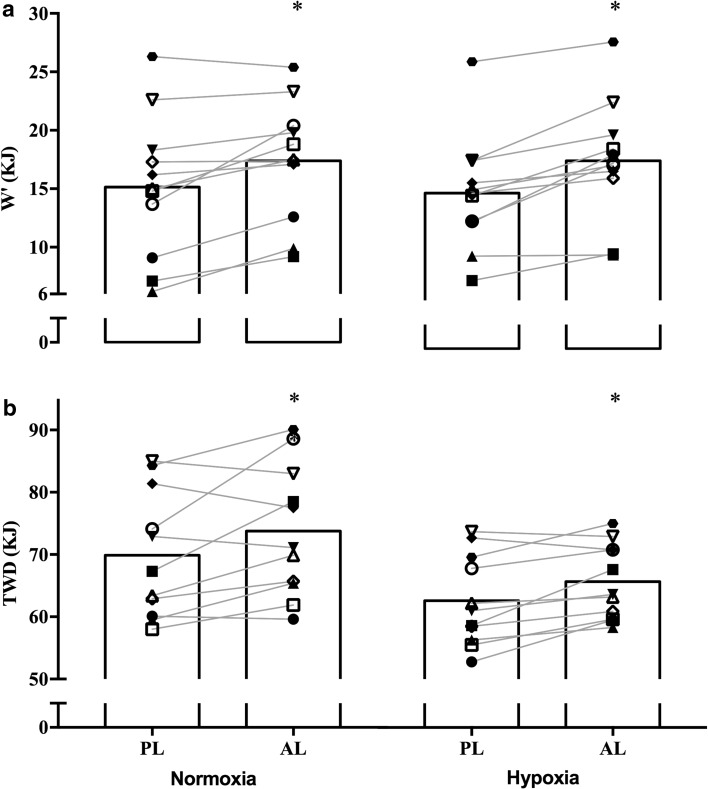
Fig. 1.
Graph a displays W’ and graph b displays TWD. These figures represent the mean values in each experimental condition, while the individual points and connecting lines represent the individual response to alkalosis under the receptive environmental conditions. Asterisk represents significantly different to placebo condition (p < 0.05)

