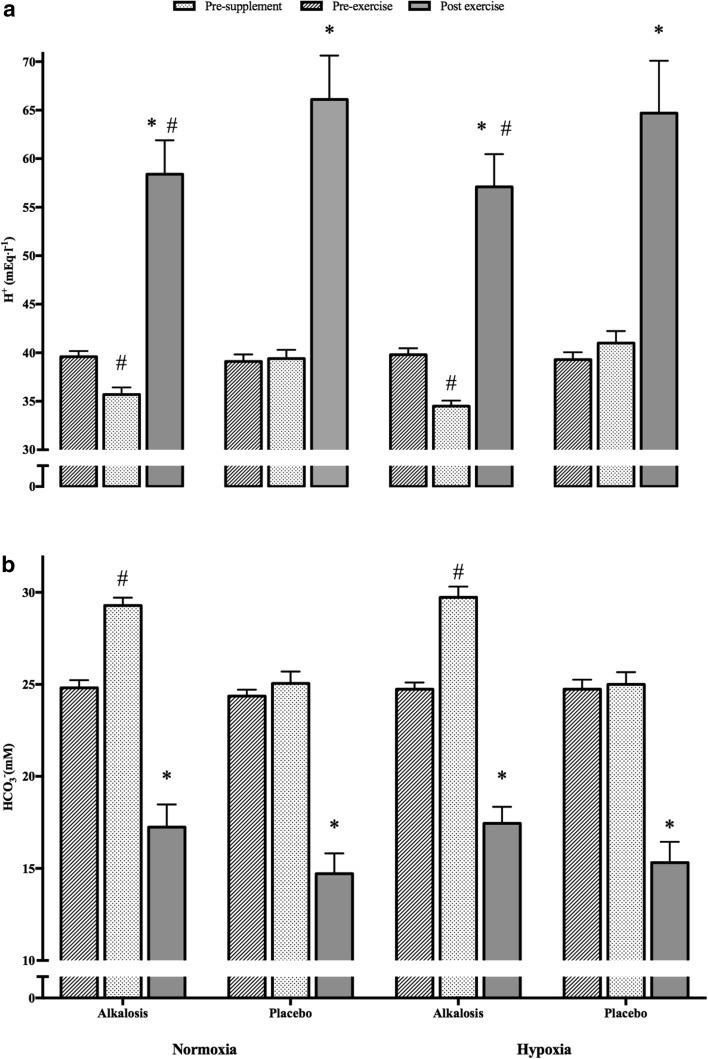
Fig. 2.
Graph a displays change in blood [H+] and graph (b) displays change in blood [HCO3 −] across three time points during the four different experimental trials. Error bars are displayed as SEM. Asterisk represents significantly different from pre-supplement and pre-exercise time points (p < 0.05); hash represents significantly different from placebo conditions at the same time point

