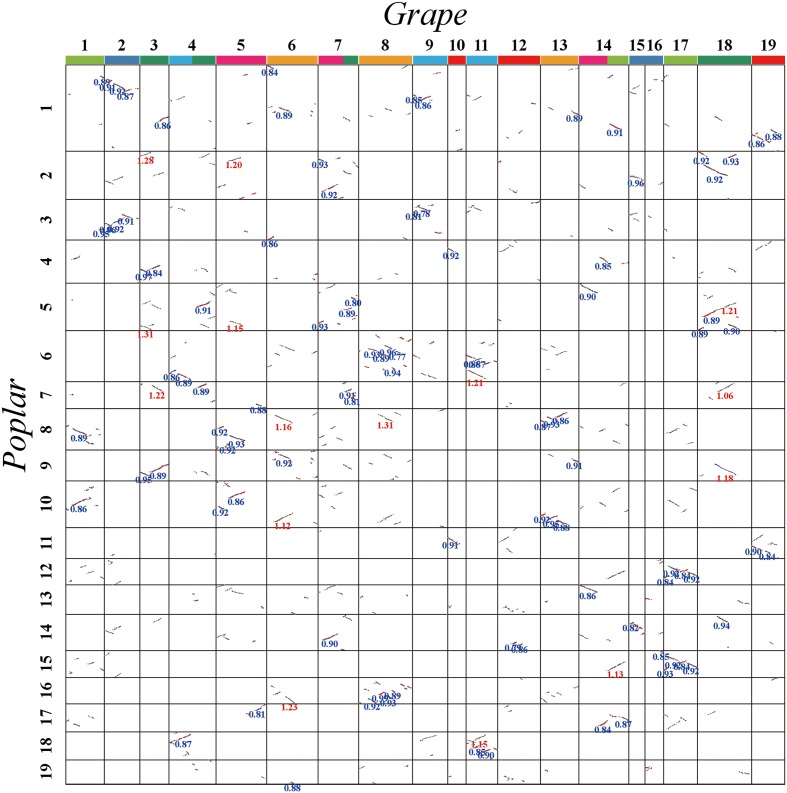
FIGURE 4.
Dot plot between grape and poplar. Grape and poplar chromosomes are aligned horizontally and vertically. Grape chromosomes are shown with blocks in seven different colors, to distinguish their origination from seven ancestral chromosomes before the major eudicot common hexaploidy (Jaillon et al., 2007). The same-colored chromosomes, or chromosomal segments, form a triplet of homoeologs produced by the hexaploidy. Homologous gene pairs are shown in red, blue, and gray to denote the best, second-best, and other matches, respectively. The synonymous substitution values (Ks) next to the homogeneous block are divided into red and blue according to the obviously separated locations of Ks peaks (i.e., divergence event).

