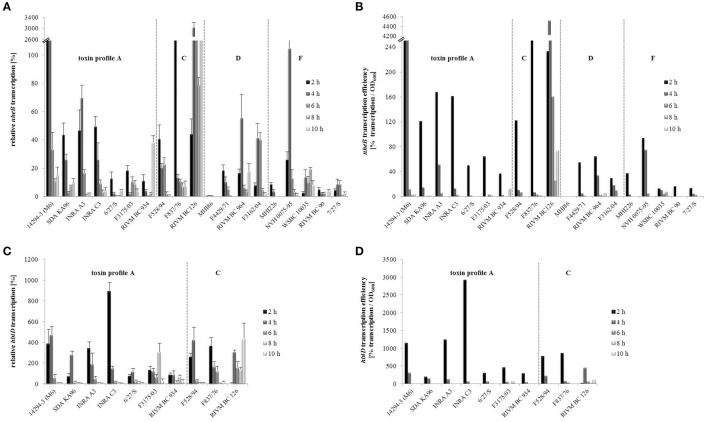
Figure 2.
Enterotoxin gene transcription of the B. cereus strains. nheB (A) and hblD (C) transcription was determined by qRT-PCR, normalized to 16S rrn levels of the same sample and relative to the transcript level of an external calibrator. hblD expression of reference strain F837/76 at 6 h growth in CGY medium (Jeßberger et al., 2015) was used as calibrator and set to 100% (log-2 = 0). With the 2−ΔΔCT method, transcription of all other samples was compared to this calibrator. Transcription efficiencies of nheB (B) and hblD (D) were determined as relative transcript level/OD600. Strains are grouped according to their enterotoxin gene profiles, which are separated by dotted lines.

