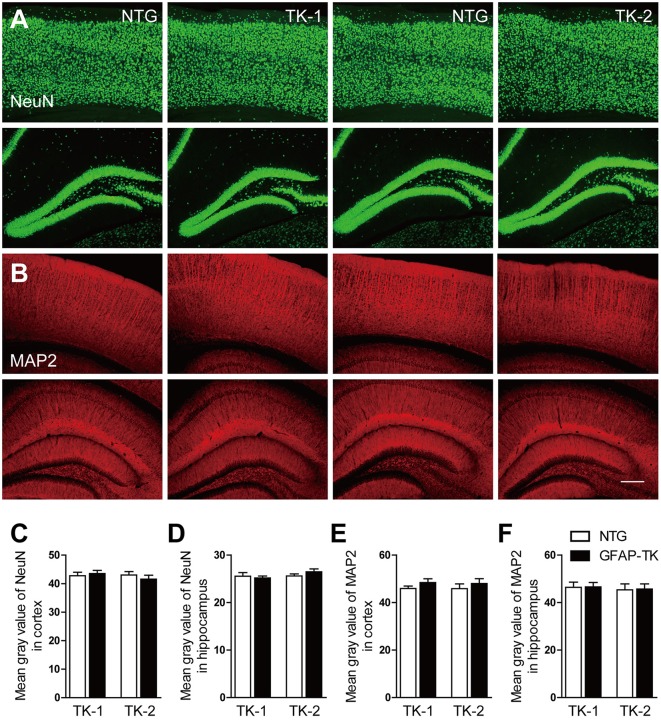
Figure 5.
The expression of NeuN and MAP2 was not affected in the cortex and hippocampus of both TK-1 and TK-2 mice (2). (A) Representative photomicrographs of NeuN+ cells in the cortex and hippocampus of 3-month-old TK-1 and TK-2 mice and their age-matched controls. (B) Representative photomicrographs of MAP2+ cells in the cortex and hippocampus of 3-month-old TK-1 and TK-2 mice and their age-matched controls. Scale bar, 200 μm. (C,D) Quantification of the fluorescence intensity of NeuN positive signals in the cortex and hippocampus. (n = 3 mice per group, 3 brain slices for each mouse). (E,F) Quantification of the fluorescence intensity of MAP2 positive signals in the cortex and hippocampus. (n = 3 mice per group, 3 brain slices for each mouse). Data represent mean ± SEM.

