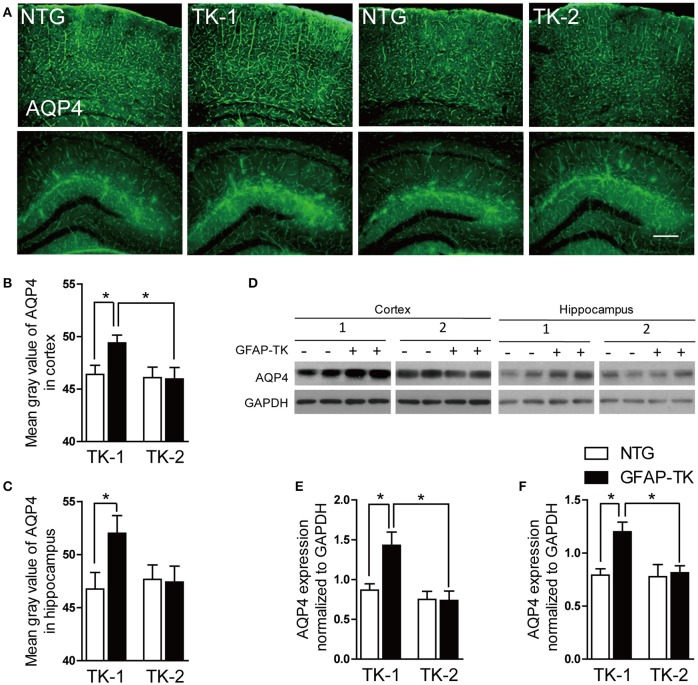
Figure 6.
The expression of AQP4 was increased in the cortex and hippocampus of 3-month-old TK-1 mice. (A) Representative photomicrographs of AQP4 expression in the cortex and hippocampus of 3-month-old TK-1 and TK-2 mice and their age-matched controls. Scale bar, 200 μm. (B,C) Fluorescence intensity was quantified by using image-analysis software in the cortex and hippocampus. (n = 3 mice per group, 3 brain slices for each mouse). (D) Protein bands of AQP4 in the cortex and hippocampus, GAPDH severed as the loading control. (E) Quantification of the level of AQP4 in the cortex of 3-month-old TK-1 (n = 7 mice) and TK-2 mice (n = 4 mice) and their age-matched controls (n = 4 mice per group). (F) Quantification of the level of AQP4 in the hippocampus of 3-month-old TK-1 (n = 7 mice) and TK-2 mice (n = 4 mice) and their age-matched controls (n = 4 mice per group). Data represent mean ± SEM, *P < 0.05 (unpaired t-test).

